Fig. 2.
Download original image
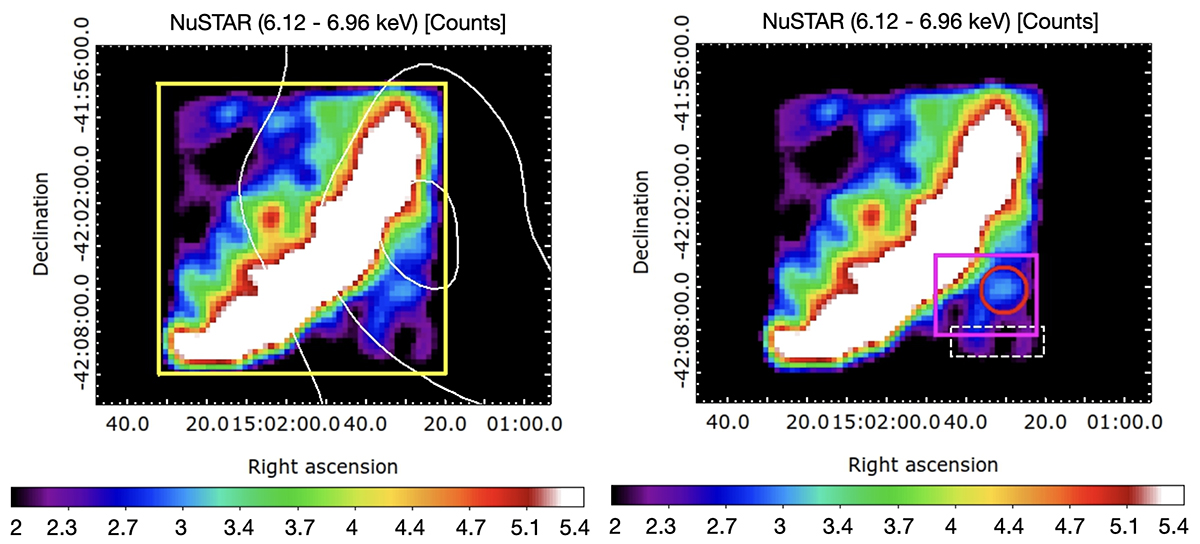
NuSTAR observation of the southwestern part of SN 1006 in linear scale obtained as the sum of FPMA and FPMB in the 6.12 − 6.96 keV band. The pixel size is 14.7″. Left panel shows, in white, the contour levels of the column density (Fig. 1). The red circle on the right shows the region selected for spectral analysis of knot1 and the white dashed rectangle is the background region. The magenta box shows the field of view of the three panels in Fig. 3.
Current usage metrics show cumulative count of Article Views (full-text article views including HTML views, PDF and ePub downloads, according to the available data) and Abstracts Views on Vision4Press platform.
Data correspond to usage on the plateform after 2015. The current usage metrics is available 48-96 hours after online publication and is updated daily on week days.
Initial download of the metrics may take a while.