Open Access
Fig. B.1.
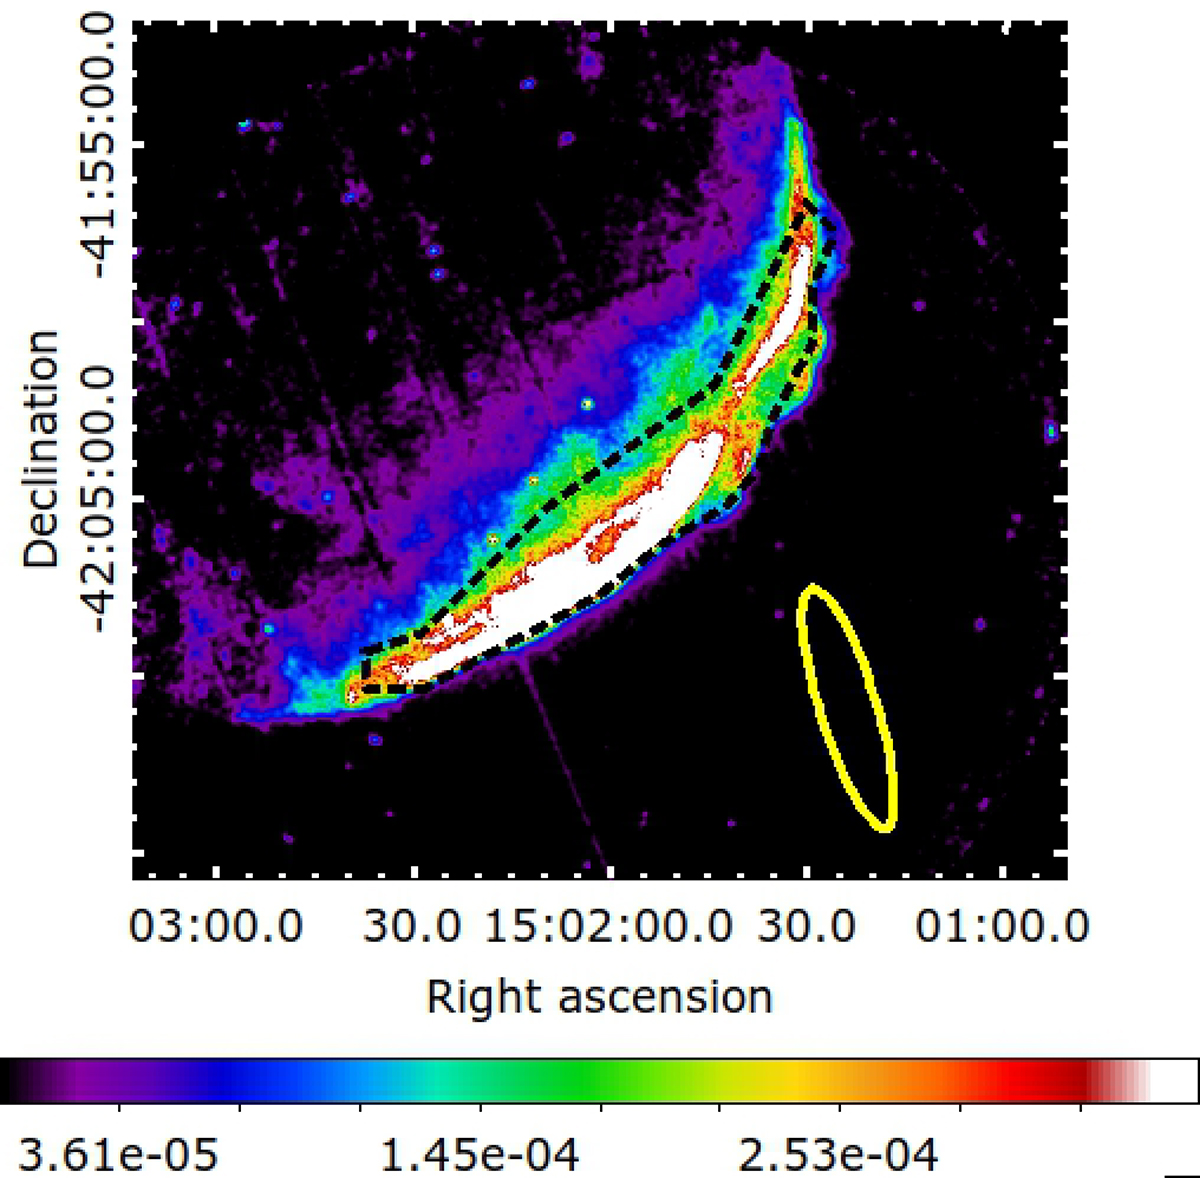
Download original image
XMM-Newton flux image in counts/s of the SW limb of SN 1006. The black-dashed line shows the region useful for the X-ray data analysis from the SW limb. The yellow region marks the background region used to extract the EPIC-pn spectrum.
Current usage metrics show cumulative count of Article Views (full-text article views including HTML views, PDF and ePub downloads, according to the available data) and Abstracts Views on Vision4Press platform.
Data correspond to usage on the plateform after 2015. The current usage metrics is available 48-96 hours after online publication and is updated daily on week days.
Initial download of the metrics may take a while.