Fig. 1.
Download original image
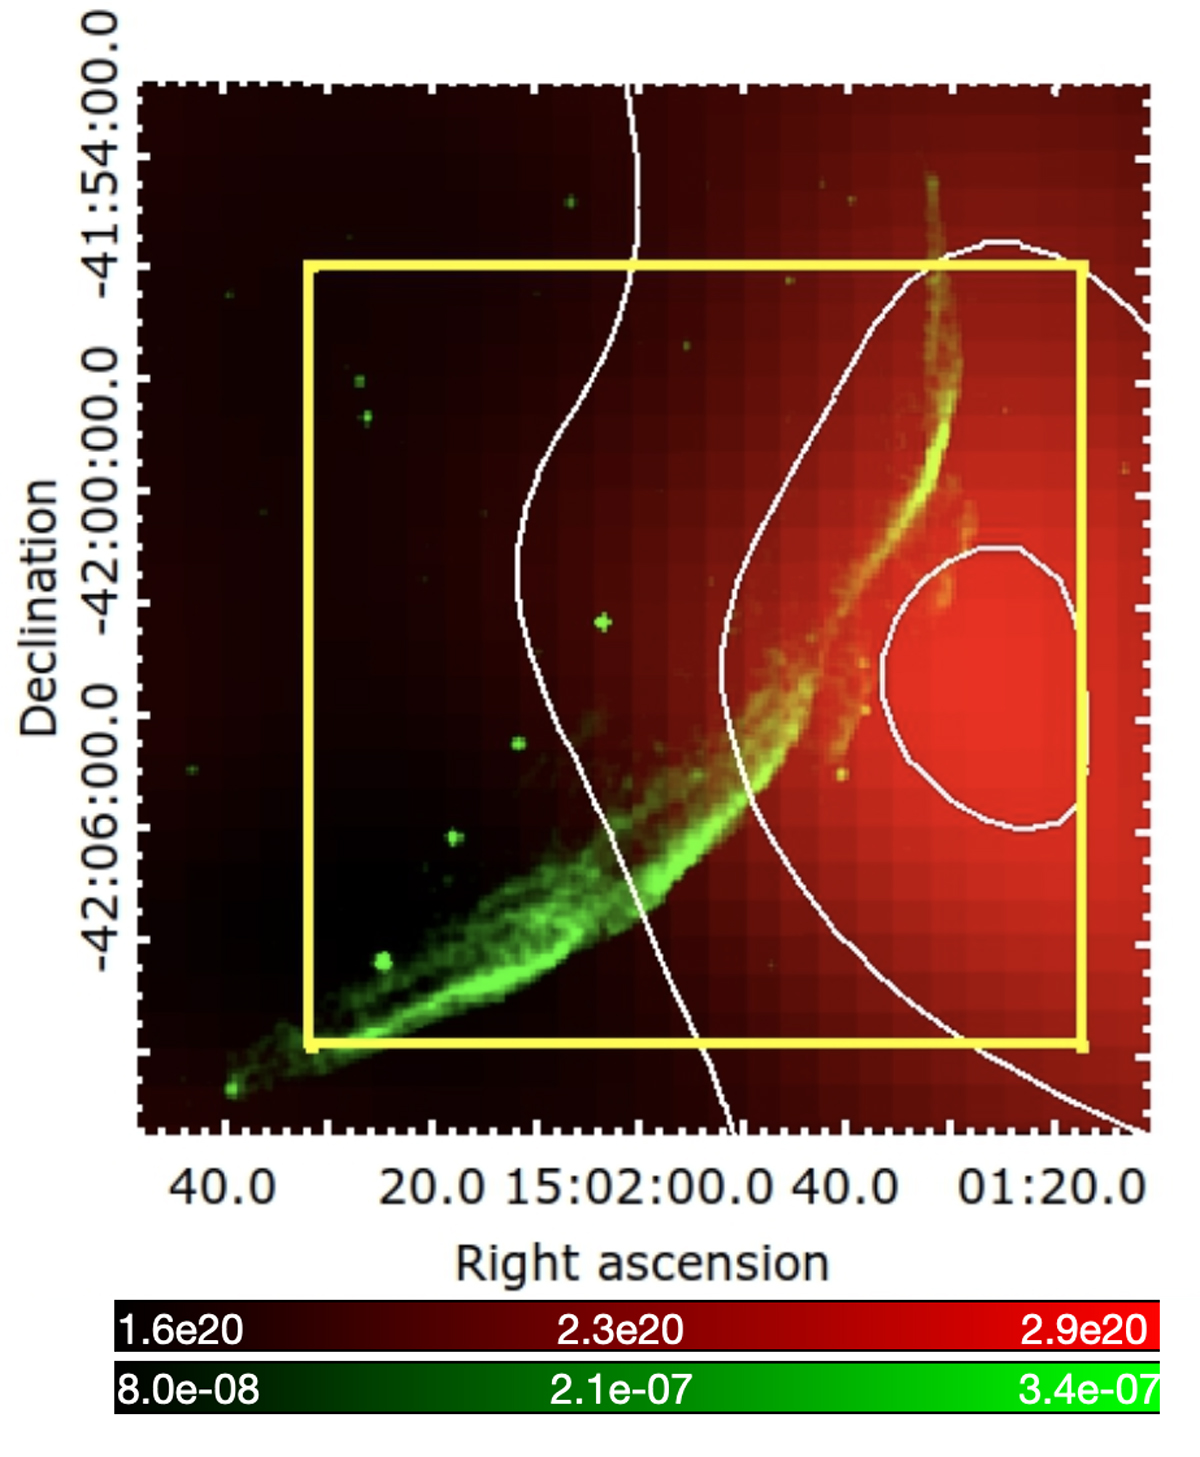
Chandra flux map of SN 1006 in count s−1 cm−2 in the 2.5–7 keV (green) band. The column density of HI in the [ + 5.8, + 10.7] km s −1 velocity range is shown in red. The contour levels of the column density at the 65%, 80% and 95% of the maximum (2.9 × 1020 cm−2) are shown in white. The yellow rectangle shows the NuSTAR field of view.
Current usage metrics show cumulative count of Article Views (full-text article views including HTML views, PDF and ePub downloads, according to the available data) and Abstracts Views on Vision4Press platform.
Data correspond to usage on the plateform after 2015. The current usage metrics is available 48-96 hours after online publication and is updated daily on week days.
Initial download of the metrics may take a while.