Fig. 8.
Download original image
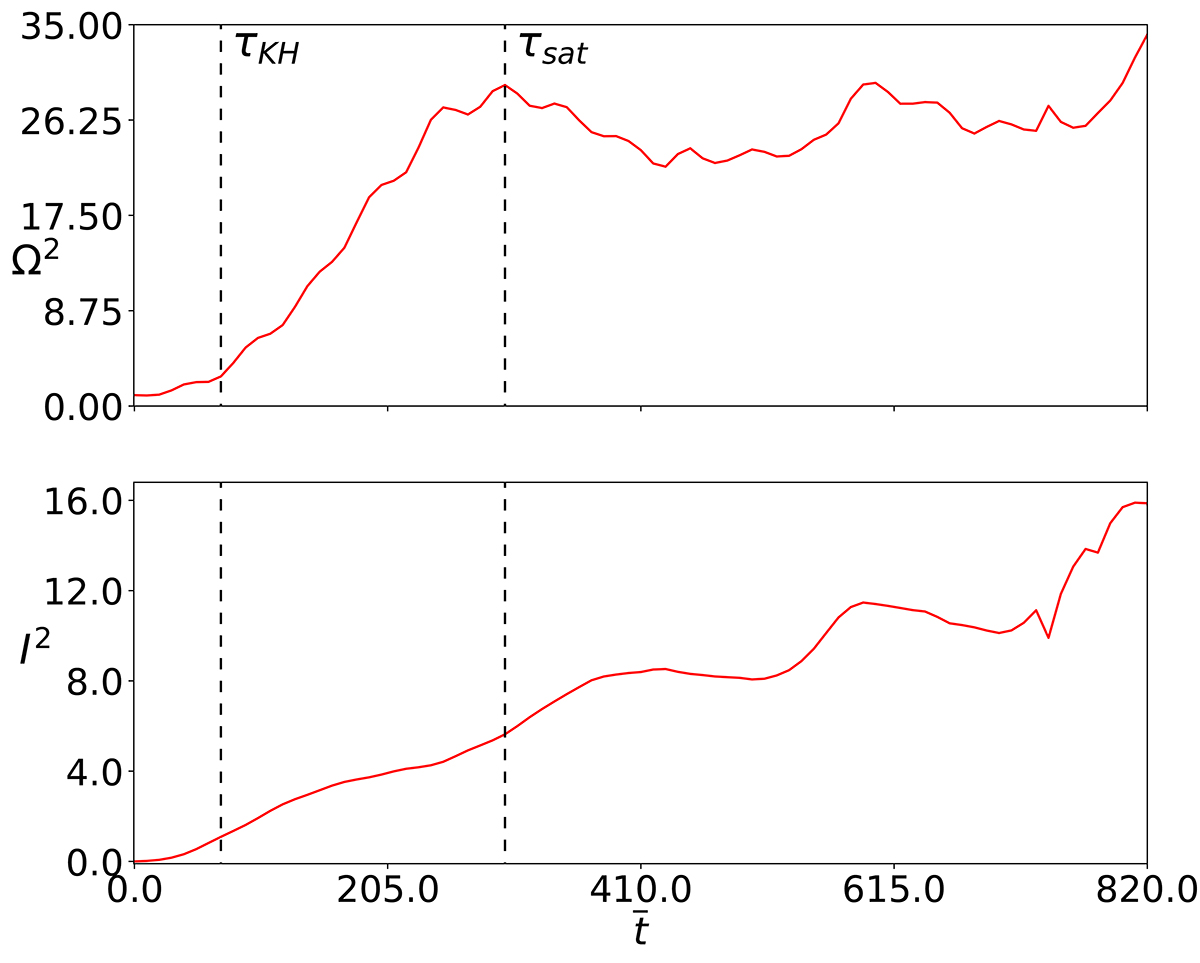
Temporal evolution of the vorticity squared (top panel) and the current density squared (bottom panel) integrated in the whole computational domain. The vorticity values are normalized with respect to the initial value. The two dashed black lines show respectively the onset of the Kelvin–Helmholtz instability inferred from the analysis of azimuthal modes, τKH = 70, and the time at which the integrated vorticity squared saturates, τsat = 300.
Current usage metrics show cumulative count of Article Views (full-text article views including HTML views, PDF and ePub downloads, according to the available data) and Abstracts Views on Vision4Press platform.
Data correspond to usage on the plateform after 2015. The current usage metrics is available 48-96 hours after online publication and is updated daily on week days.
Initial download of the metrics may take a while.