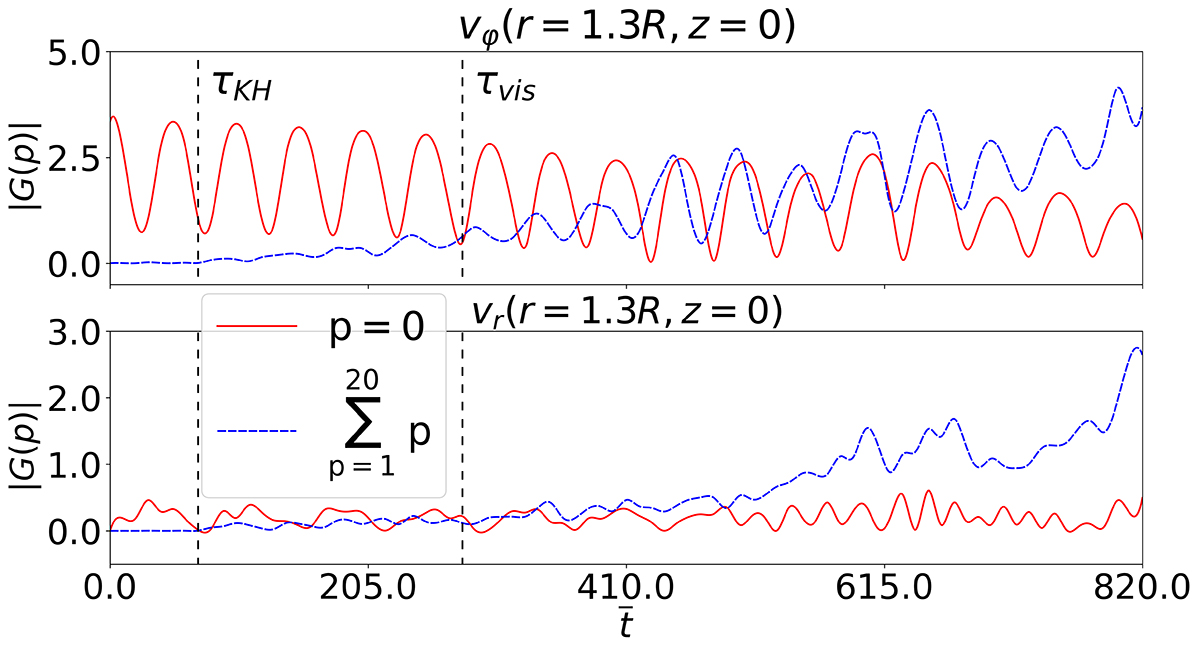
Fig. 7.
Download original image
Top panel: temporal evolution of the Fourier coefficient with p = 0 (red solid line) and of the sum of the modulus of the first twenty positive Fourier coefficients (blue dashed line). For this analysis, the azimuthal component of velocity along a circle of radius 1.3R at the z = 0 plane is used. The two vertical dashed black lines show, respectively, the onset of the KHI obtained from this Fourier analysis, τKH ≈ 70, and the time at which the KHI is first seen to grow in the density, τvis = 280. Bottom panel: same as the top panel but for the radial component of velocity.
Current usage metrics show cumulative count of Article Views (full-text article views including HTML views, PDF and ePub downloads, according to the available data) and Abstracts Views on Vision4Press platform.
Data correspond to usage on the plateform after 2015. The current usage metrics is available 48-96 hours after online publication and is updated daily on week days.
Initial download of the metrics may take a while.