Fig. 5.
Download original image
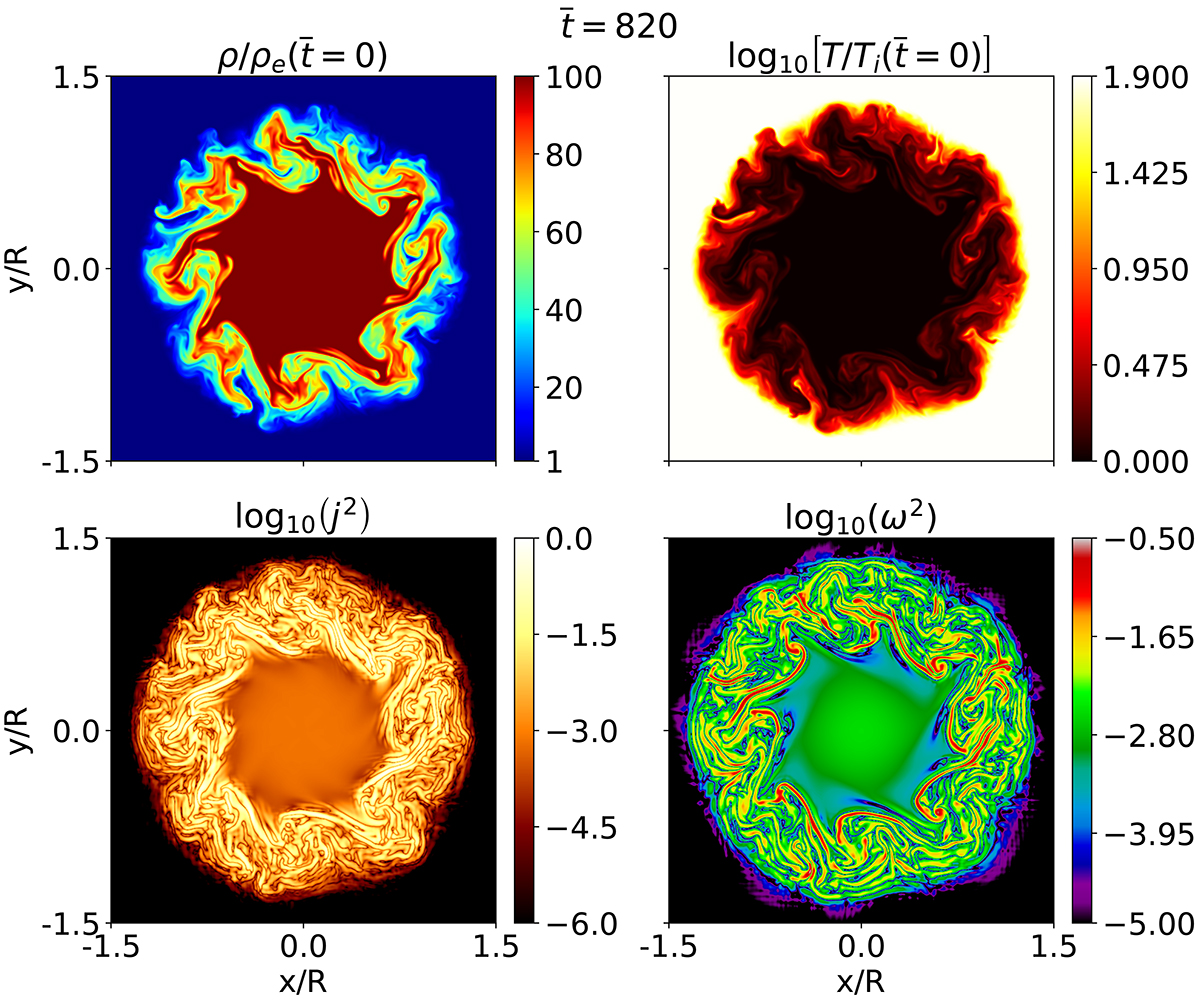
Cross-sectional cuts of density (top left), temperature (top right), current density squared (bottom left), and vorticity squared (bottom right) at the end of the ideal MHD simulation, ![]() . Temperature is normalized with respect to the initial value at r = 0. Logarithmic scale is used for each variable except for the density to optimize visualization. The cross-sectional cuts are done at the tube center, z = 0, except for current density squared which is done at z = R. The complete temporal evolution is available as an online movie.
. Temperature is normalized with respect to the initial value at r = 0. Logarithmic scale is used for each variable except for the density to optimize visualization. The cross-sectional cuts are done at the tube center, z = 0, except for current density squared which is done at z = R. The complete temporal evolution is available as an online movie.
Current usage metrics show cumulative count of Article Views (full-text article views including HTML views, PDF and ePub downloads, according to the available data) and Abstracts Views on Vision4Press platform.
Data correspond to usage on the plateform after 2015. The current usage metrics is available 48-96 hours after online publication and is updated daily on week days.
Initial download of the metrics may take a while.