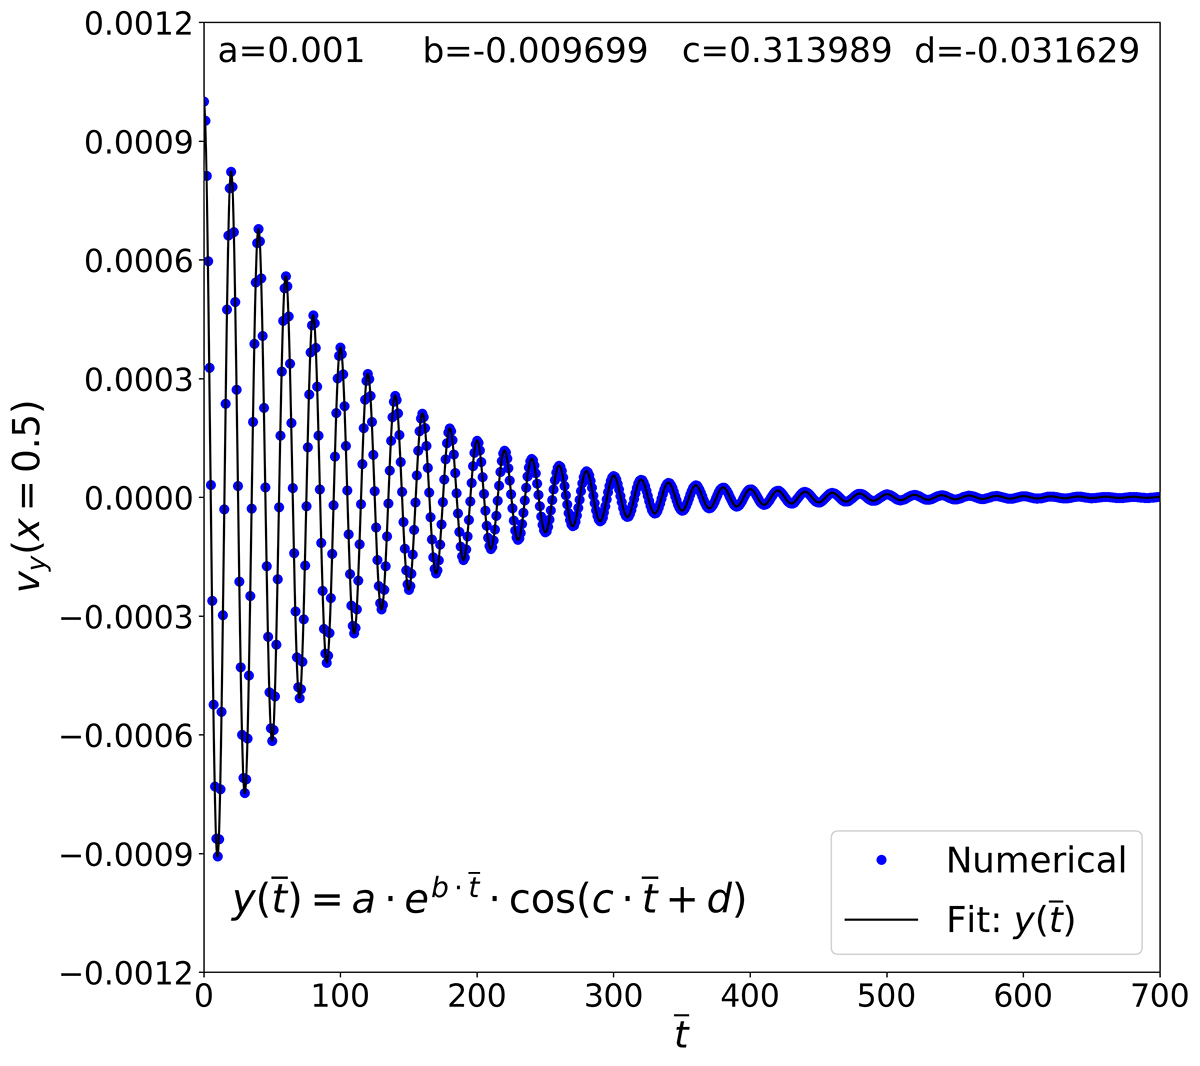
Fig. B.1.
Download original image
Temporal evolution of the y component of velocity at the anti-node. The blue dots corresponds to the results from the 1.5D simulation while the black solid line corresponds to the fitting of the data by a damped sine function, as indicated in the plot. Code units are used.
Current usage metrics show cumulative count of Article Views (full-text article views including HTML views, PDF and ePub downloads, according to the available data) and Abstracts Views on Vision4Press platform.
Data correspond to usage on the plateform after 2015. The current usage metrics is available 48-96 hours after online publication and is updated daily on week days.
Initial download of the metrics may take a while.