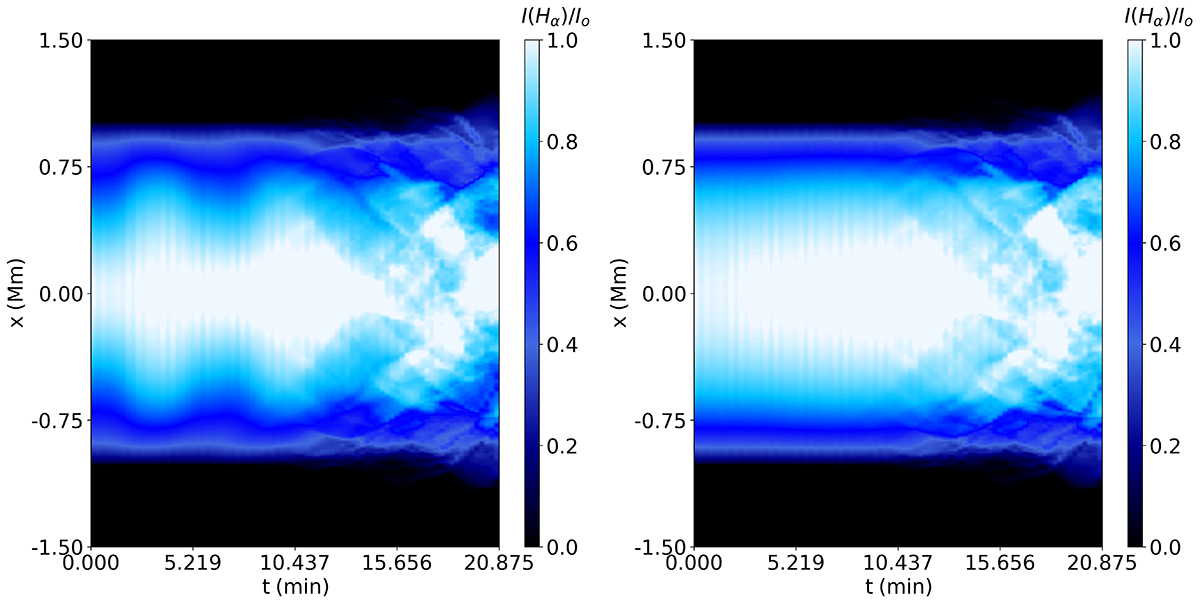
Fig. 14.
Download original image
Time-distance map of the normalized specific intensity across the thread at the rest frequency of Hα (left). The normalization is done with respect to the maximum value at the beginning of the simulation. Right panel is the same as the left, but neglecting the LOS velocities.
Current usage metrics show cumulative count of Article Views (full-text article views including HTML views, PDF and ePub downloads, according to the available data) and Abstracts Views on Vision4Press platform.
Data correspond to usage on the plateform after 2015. The current usage metrics is available 48-96 hours after online publication and is updated daily on week days.
Initial download of the metrics may take a while.