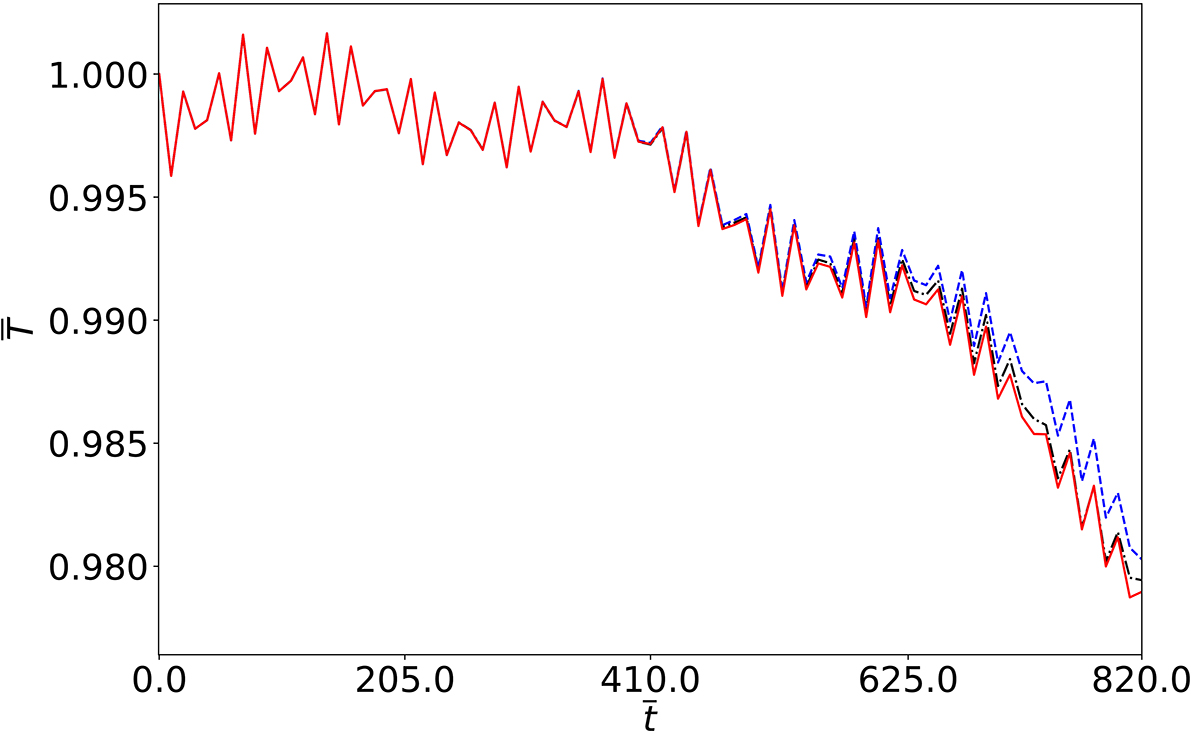
Fig. 12.
Download original image
Temporal evolution of the average temperature in a subdomain where x/R ∈ [−1.4,1.4], y/R ∈ [−1.4,1.4], and z/R ∈ [−4,4] for the ideal simulation (solid red line), the Ohmic simulation (blue dashed line) and the Cowling simulation (black dash-dotted line). The temperature is normalized with respect to the initial average temperature.
Current usage metrics show cumulative count of Article Views (full-text article views including HTML views, PDF and ePub downloads, according to the available data) and Abstracts Views on Vision4Press platform.
Data correspond to usage on the plateform after 2015. The current usage metrics is available 48-96 hours after online publication and is updated daily on week days.
Initial download of the metrics may take a while.