Fig. 9.
Download original image
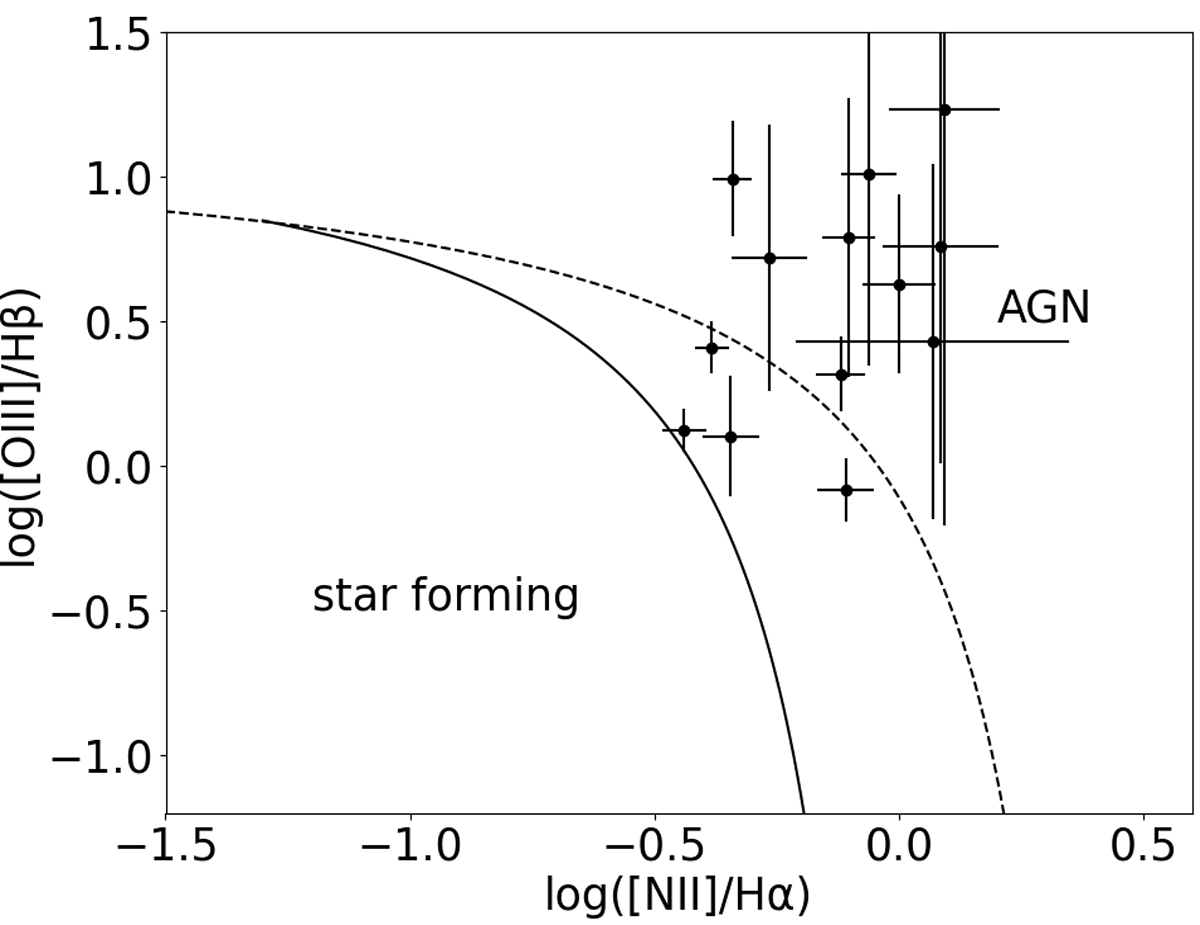
BPT diagram of the 13 sources with prominent narrow emission lines in their optical spectra (FWHM (Balmer) < 500 km s−1). The continuous curve denotes the star-forming and AGN division of Kauffmann et al. (2003), while the dashed curve the respective source separation of Kewley et al. (2001). Based on this scheme, all the sources fall in the AGN part (above the continuous curve), while four of them may also include contribution from star formation (between the curves).
Current usage metrics show cumulative count of Article Views (full-text article views including HTML views, PDF and ePub downloads, according to the available data) and Abstracts Views on Vision4Press platform.
Data correspond to usage on the plateform after 2015. The current usage metrics is available 48-96 hours after online publication and is updated daily on week days.
Initial download of the metrics may take a while.