Fig. 4.
Download original image
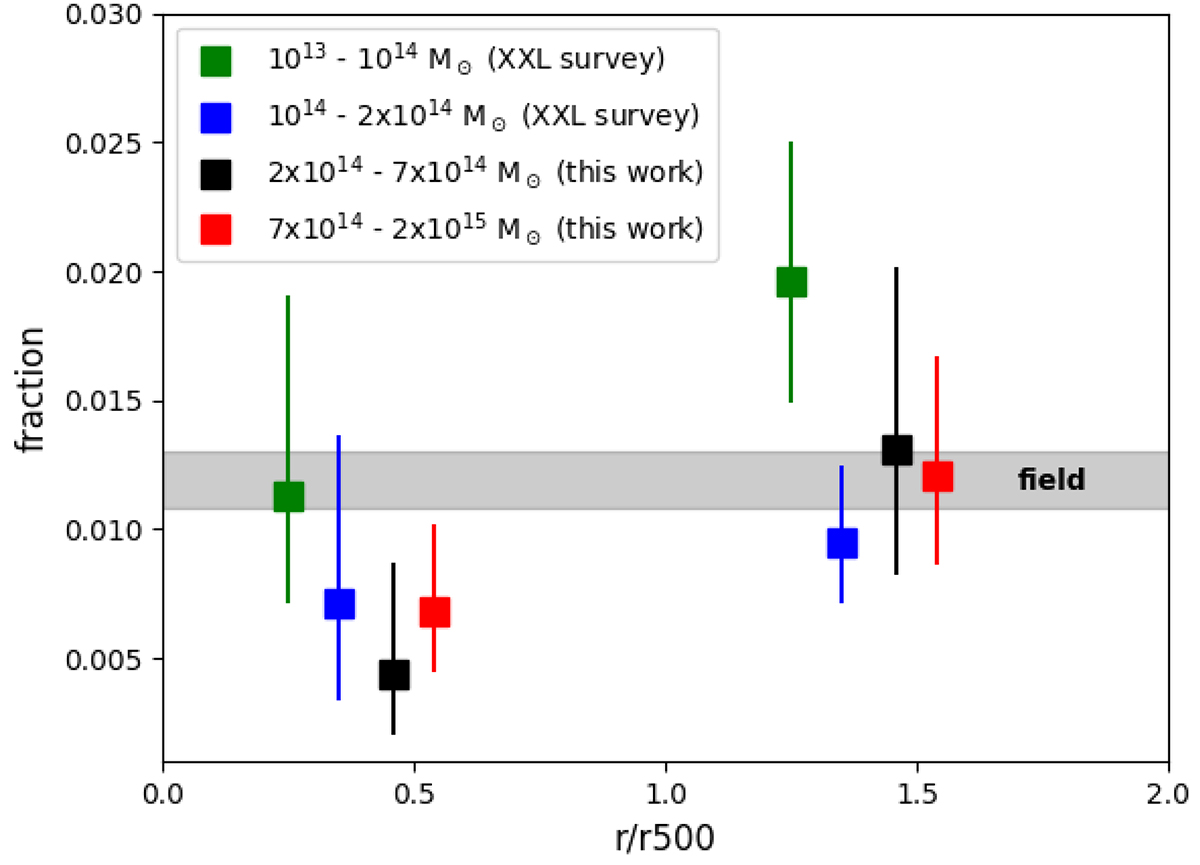
Fraction of cluster galaxies (![]() ) hosting an X-ray AGN (LX[0.5 − 10 keV] > 1042 erg s−1). The results are plotted as a function of distance from the cluster centre. The sample is divided in two based on cluster mass. Error bars indicate the 1σ confidence limits for small numbers of events (Gehrels 1986). For comparison, we plot results from the analysis of massive clusters by Koulouridis et al. (2018, namely: 167 clusters, 0.1 < z < 0.5). A significant AGN excess is found at the 95% confidence level only in the outskirts of low mass clusters (M < 1014 M⊙).
) hosting an X-ray AGN (LX[0.5 − 10 keV] > 1042 erg s−1). The results are plotted as a function of distance from the cluster centre. The sample is divided in two based on cluster mass. Error bars indicate the 1σ confidence limits for small numbers of events (Gehrels 1986). For comparison, we plot results from the analysis of massive clusters by Koulouridis et al. (2018, namely: 167 clusters, 0.1 < z < 0.5). A significant AGN excess is found at the 95% confidence level only in the outskirts of low mass clusters (M < 1014 M⊙).
Current usage metrics show cumulative count of Article Views (full-text article views including HTML views, PDF and ePub downloads, according to the available data) and Abstracts Views on Vision4Press platform.
Data correspond to usage on the plateform after 2015. The current usage metrics is available 48-96 hours after online publication and is updated daily on week days.
Initial download of the metrics may take a while.