Fig. 2.
Download original image
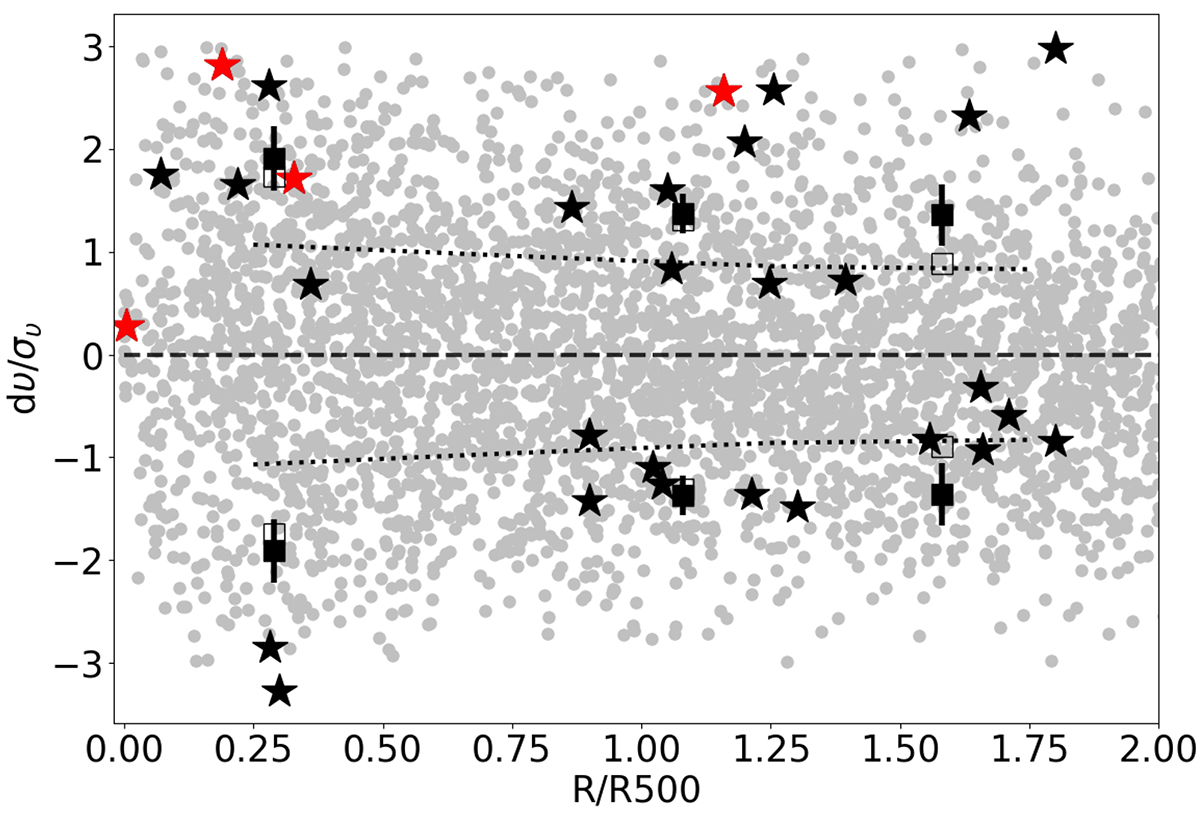
dυ/συ vs. R/R500 diagram. Grey circles mark cluster galaxies, while the dotted line indicates their velocity dispersion. Stars mark the position of X-ray-detected AGN and the red colour indicates those that exhibit broad emission lines in their optical spectra. Filled squares denote the AGN velocity dispersion in three bins of equally divided number of sources. Open squares mark the respective median values. Close to the cluster cores, X-ray-detected AGNs tend to have higher velocities with respect to the cluster than the rest of the population. This trend may indicate the presense of infalling galaxies prior to their first pericenter passage. The average AGN velocity exhibits a declining trend toward the outskirts, mirroring that of cluster galaxies.
Current usage metrics show cumulative count of Article Views (full-text article views including HTML views, PDF and ePub downloads, according to the available data) and Abstracts Views on Vision4Press platform.
Data correspond to usage on the plateform after 2015. The current usage metrics is available 48-96 hours after online publication and is updated daily on week days.
Initial download of the metrics may take a while.