Fig. 1.
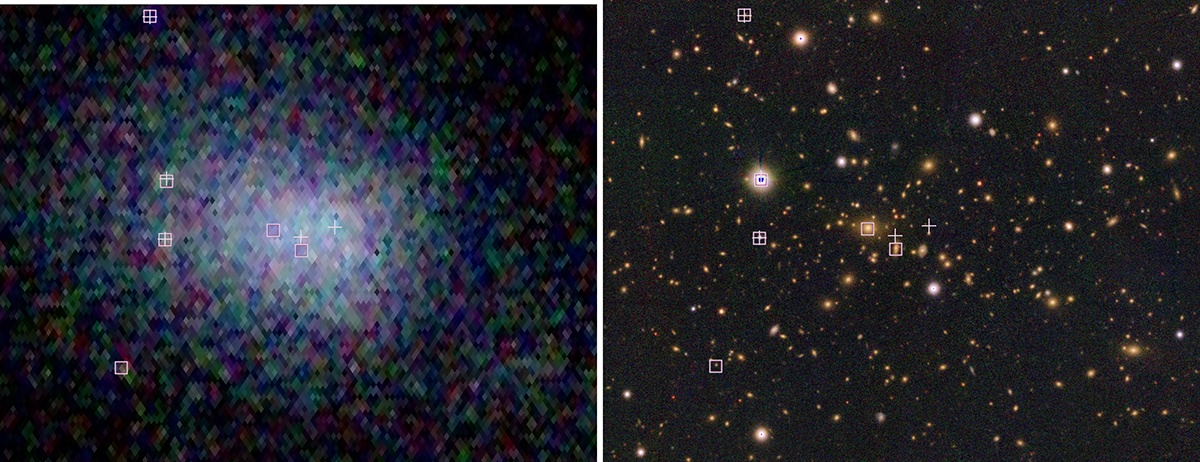
Download original image
X-ray (XMM-Newton, left panel) and optical (PanSTARRS, right panel) images of the central cluster region within 0.5 R500 of Abell 1763. Crosses and squares mark XMM-Newton and Chandra detections, respectively. Sources with a flux lower than the threshold applied in Sect. 2.2 are ommited. Chandra detects a point-like X-ray source in close proximity to the brightest cluster galaxy (BCG) and at concordant redshift with the cluster. All other sources detected by either telescope or both are discarded due to their redshift or extent, as described in Sect. 2.2.
Current usage metrics show cumulative count of Article Views (full-text article views including HTML views, PDF and ePub downloads, according to the available data) and Abstracts Views on Vision4Press platform.
Data correspond to usage on the plateform after 2015. The current usage metrics is available 48-96 hours after online publication and is updated daily on week days.
Initial download of the metrics may take a while.