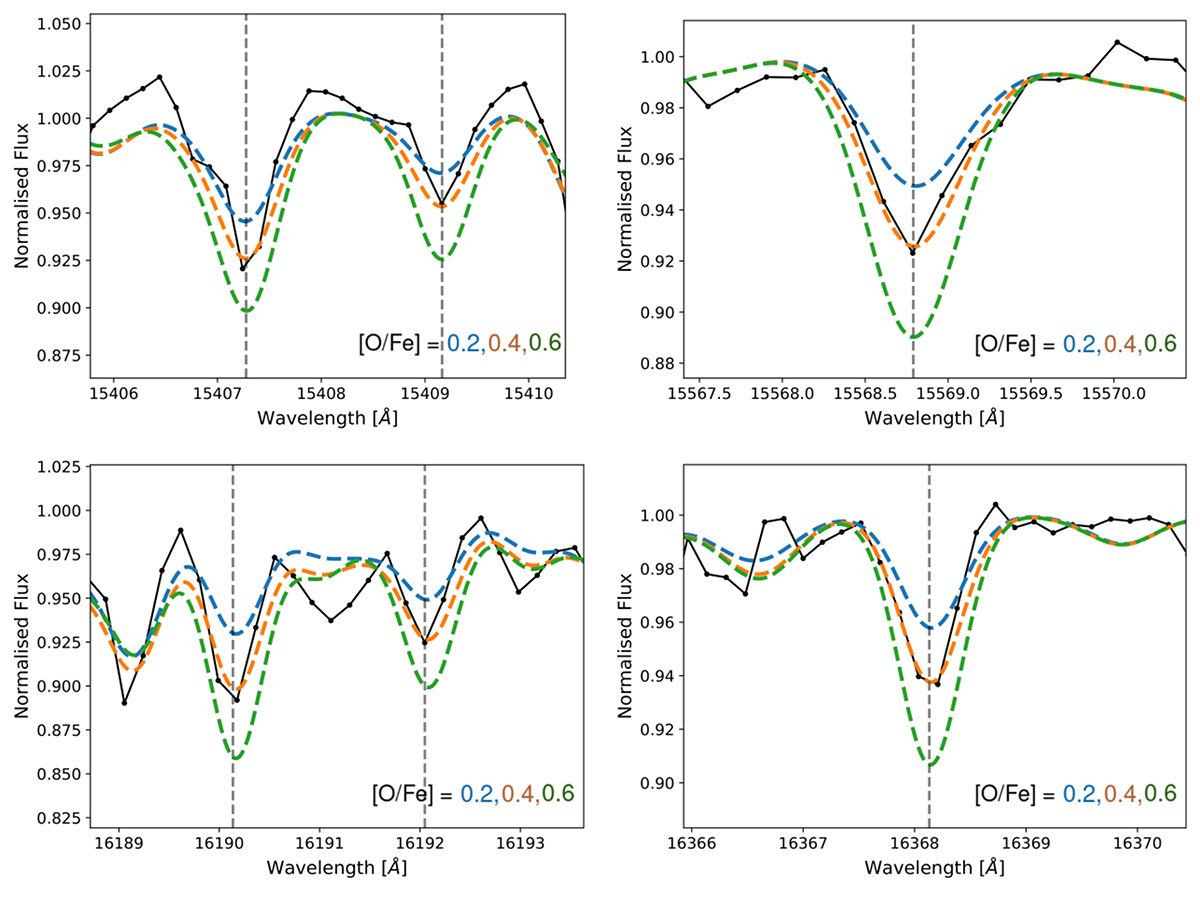
Fig. 7.
Download original image
Fitting of the OH band at 1.5 and 1.6 μm in HD 218330. The observed spectrum is shown in black, and the synthetic spectra of different oxygen abundances are shown in blue ([O/Fe] = 0.2 dex), orange ([O/Fe] = 0.4 dex), and green ([O/Fe] = 0.6 dex). The vertical dashed black line shows the OH lines considered for the abundance analysis. The best-fit line is shown in orange with O = 0.40 dex.
Current usage metrics show cumulative count of Article Views (full-text article views including HTML views, PDF and ePub downloads, according to the available data) and Abstracts Views on Vision4Press platform.
Data correspond to usage on the plateform after 2015. The current usage metrics is available 48-96 hours after online publication and is updated daily on week days.
Initial download of the metrics may take a while.