Open Access
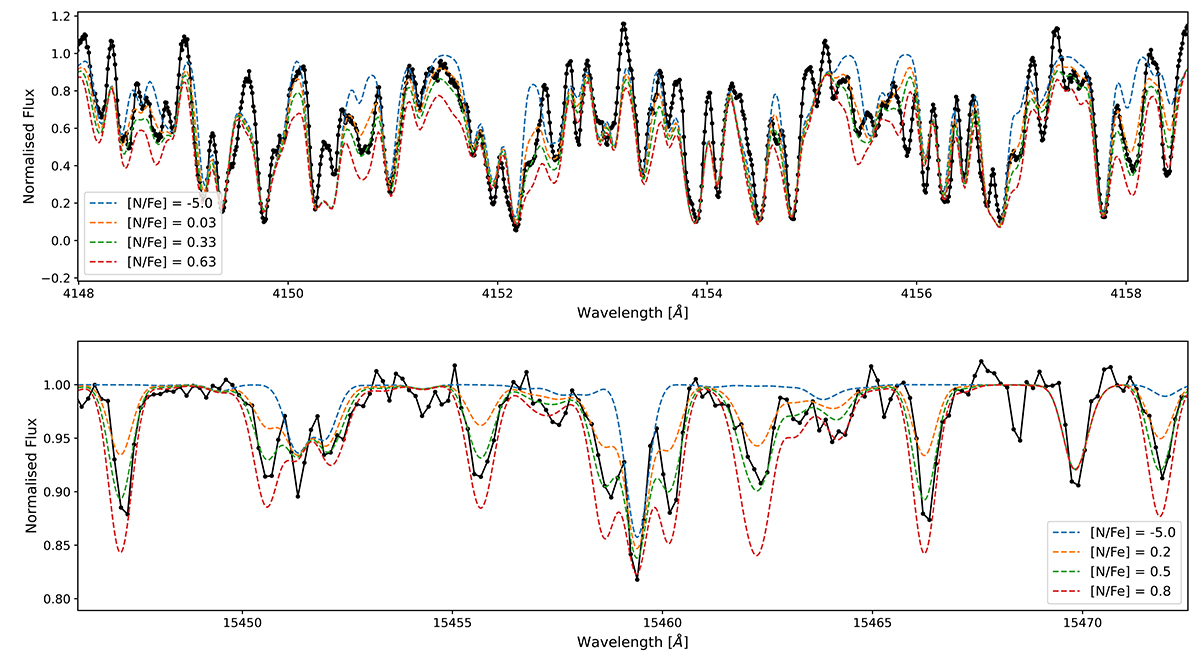
Fig. F.2.
Download original image
Fitting of CN in the optical (top panel) and IR (bottom panel) of HD218330. The different synthetic lines represent a different nitrogen abundance. The blue line ([N/Fe] = -5) shows a spectrum with almost no nitrogen. The nitrogen abundances of 0.33 and 0.5 dex are the best-fit in the optical and IR, respectively.
Current usage metrics show cumulative count of Article Views (full-text article views including HTML views, PDF and ePub downloads, according to the available data) and Abstracts Views on Vision4Press platform.
Data correspond to usage on the plateform after 2015. The current usage metrics is available 48-96 hours after online publication and is updated daily on week days.
Initial download of the metrics may take a while.