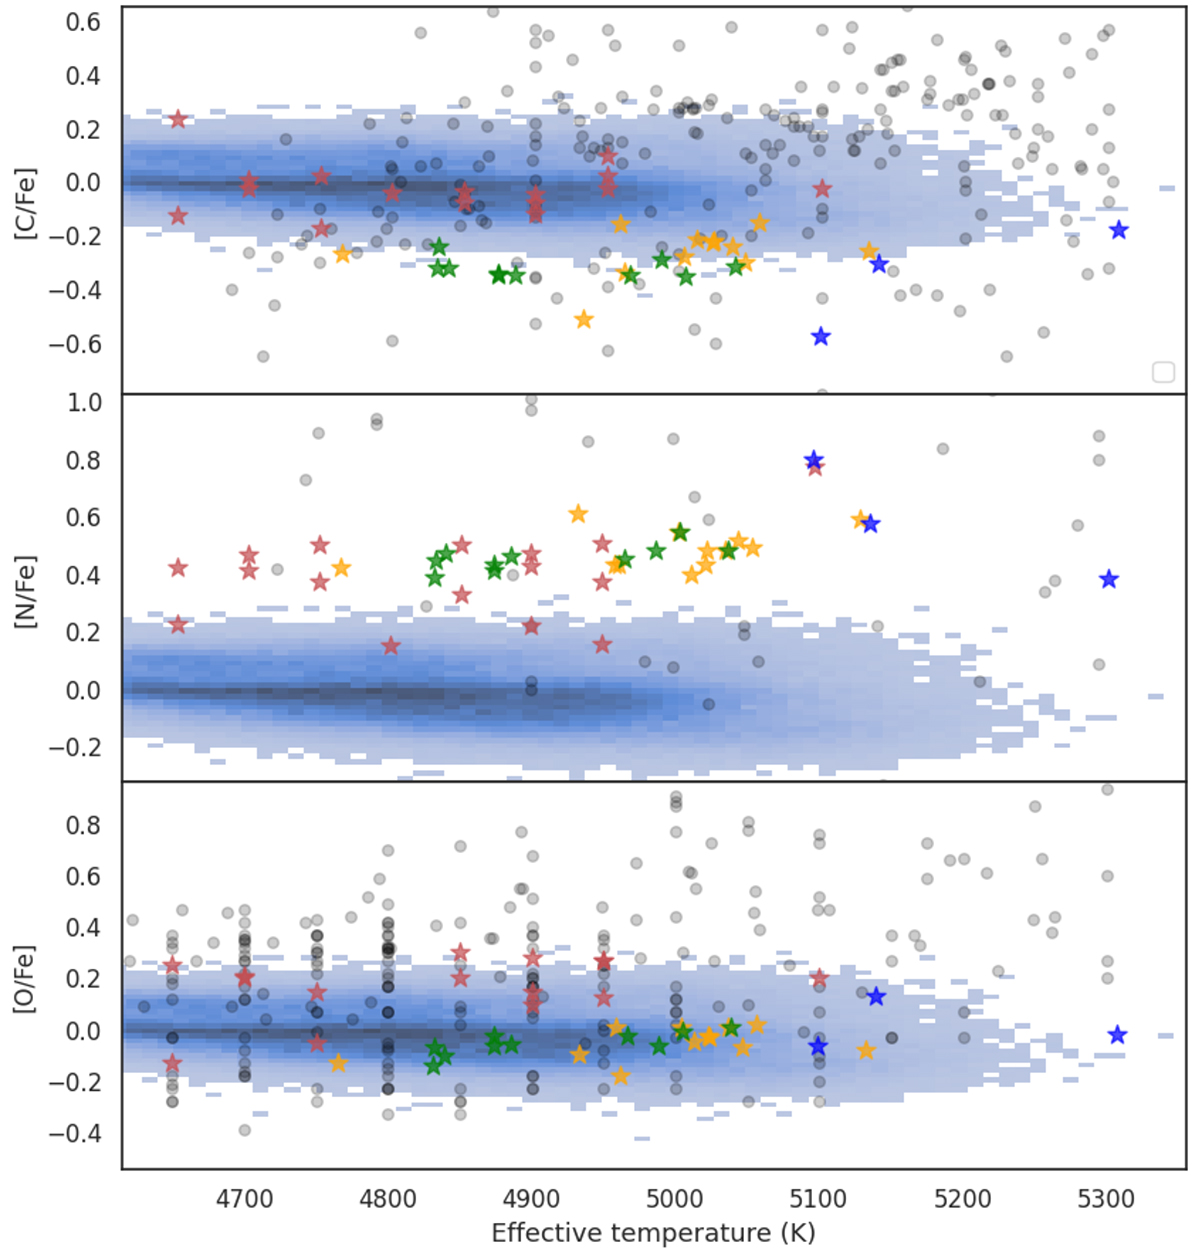
Fig. 13.
Download original image
Comparison of the average CNO abundances obtained in this work (red stars) with the literature, such as Böcek Topcu et al. (2019, orange stars), Böcek Topcu et al. (2020, green stars), Afşar et al. (2018, blue stars), the SAGA database (Suda et al. 2008, grey circles), and APOGEE (Jönsson et al. 2020). APOGEE is shown as the density plot in blue.
Current usage metrics show cumulative count of Article Views (full-text article views including HTML views, PDF and ePub downloads, according to the available data) and Abstracts Views on Vision4Press platform.
Data correspond to usage on the plateform after 2015. The current usage metrics is available 48-96 hours after online publication and is updated daily on week days.
Initial download of the metrics may take a while.