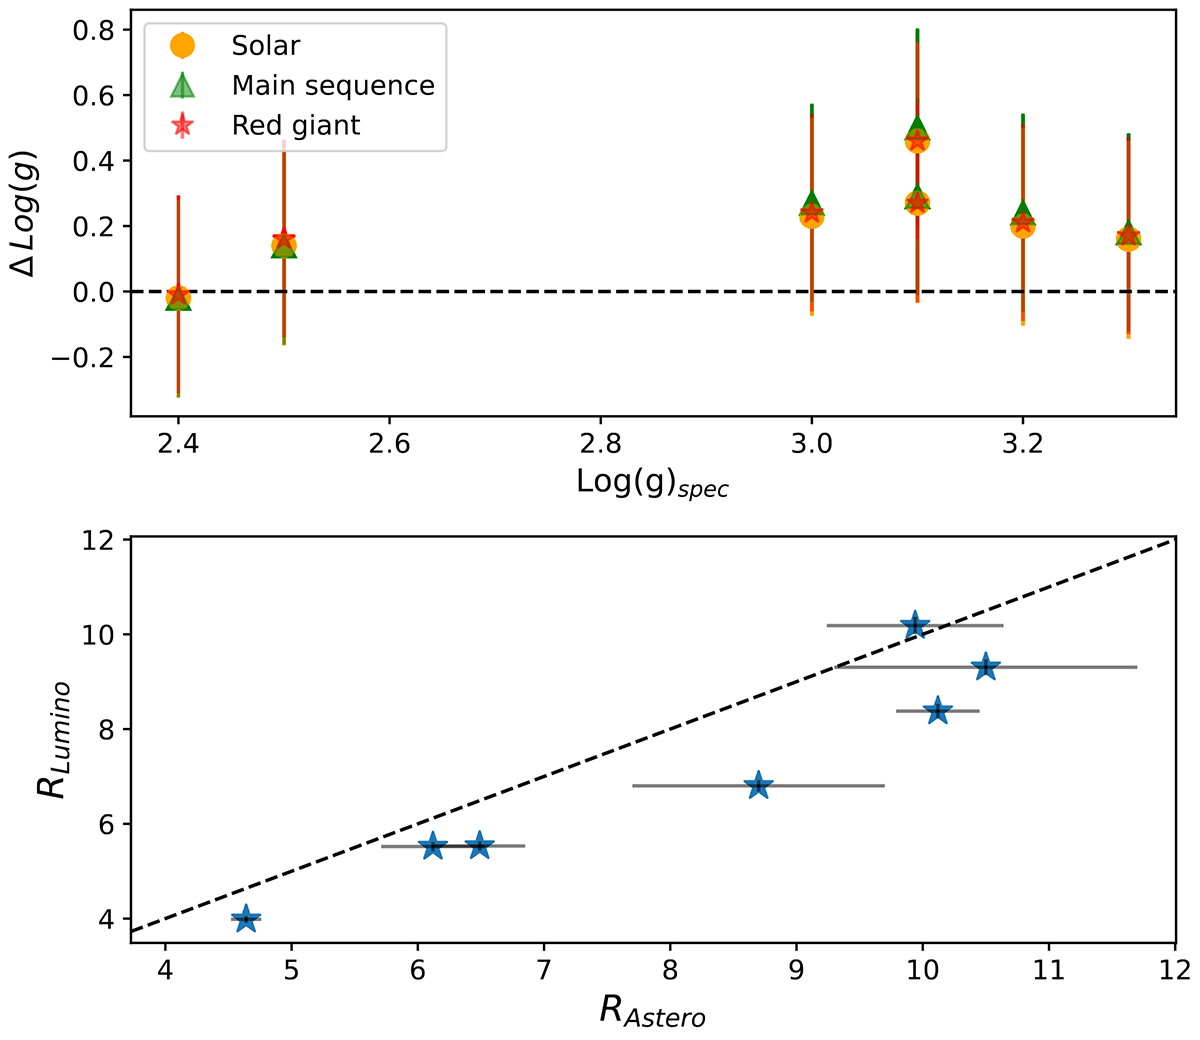
Fig. 12.
Download original image
Top: comparison of the surface gravity obtained from spectroscopy and different asteroseimic scaling relations. The yellow circles represent log(g) from the solar-type scaling relation (Kjeldsen & Bedding 1995), the green triangle shows the relation from the main-sequence scaling relation (Bellinger 2019), and the red star shows the relation from the red giant scaling relation (Bellinger 2020). Bottom: comparison of stellar radii obtained from asteroseismology and from the luminosity relation. The dashed black line represents y = x.
Current usage metrics show cumulative count of Article Views (full-text article views including HTML views, PDF and ePub downloads, according to the available data) and Abstracts Views on Vision4Press platform.
Data correspond to usage on the plateform after 2015. The current usage metrics is available 48-96 hours after online publication and is updated daily on week days.
Initial download of the metrics may take a while.