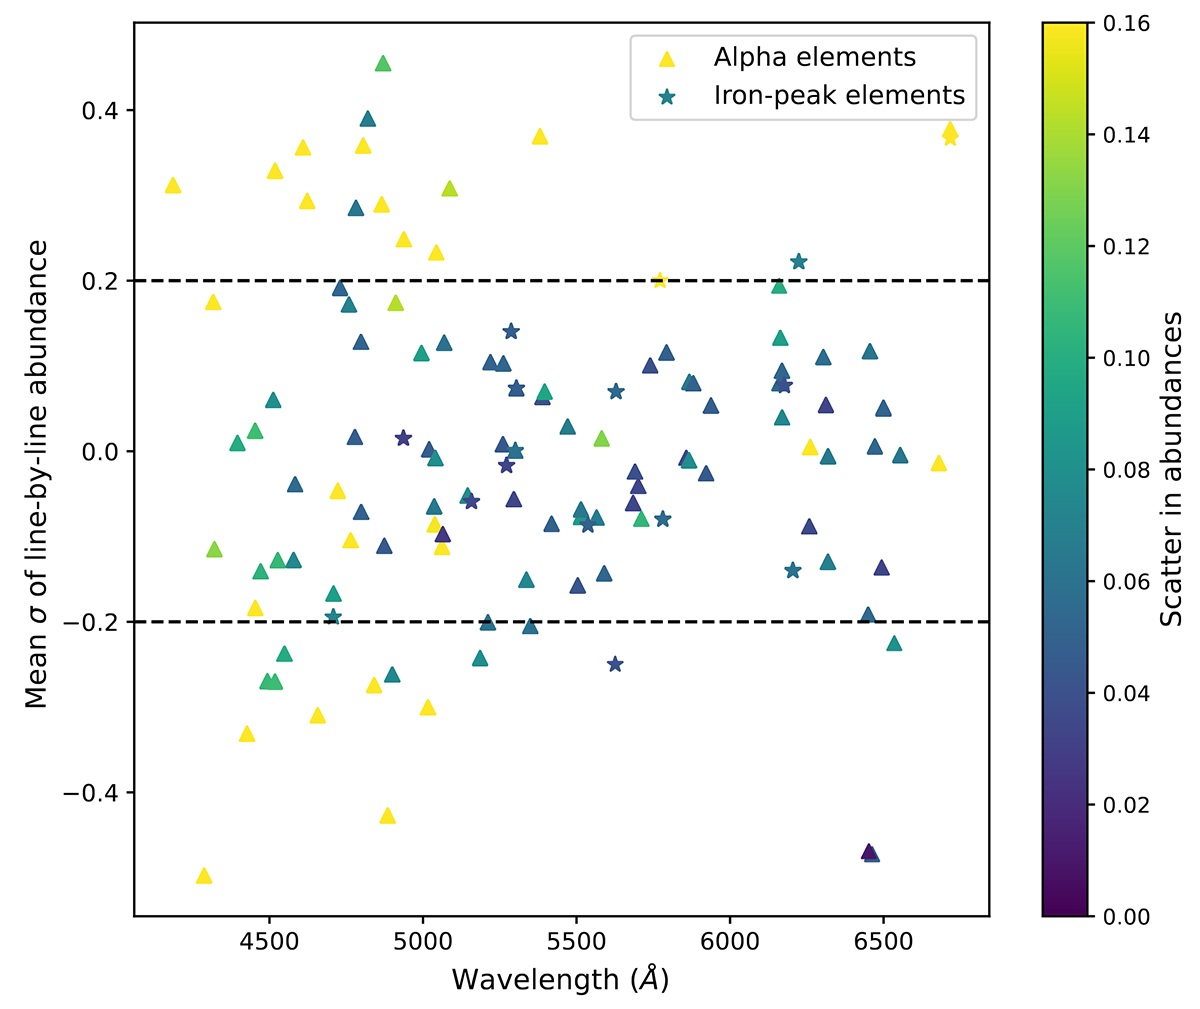
Fig. 10.
Download original image
Offset and scatter in the line-by-line abundance of α- and Fe-peak elements. The y-axis represents the mean of the standard deviation of the line-by-line abundance (average abundance from all the lines – abundance from the line). The colour represents the scatter of the standard deviation in different stars. The black line represents the offset limit of the mean, beyond which the line is discarded.
Current usage metrics show cumulative count of Article Views (full-text article views including HTML views, PDF and ePub downloads, according to the available data) and Abstracts Views on Vision4Press platform.
Data correspond to usage on the plateform after 2015. The current usage metrics is available 48-96 hours after online publication and is updated daily on week days.
Initial download of the metrics may take a while.