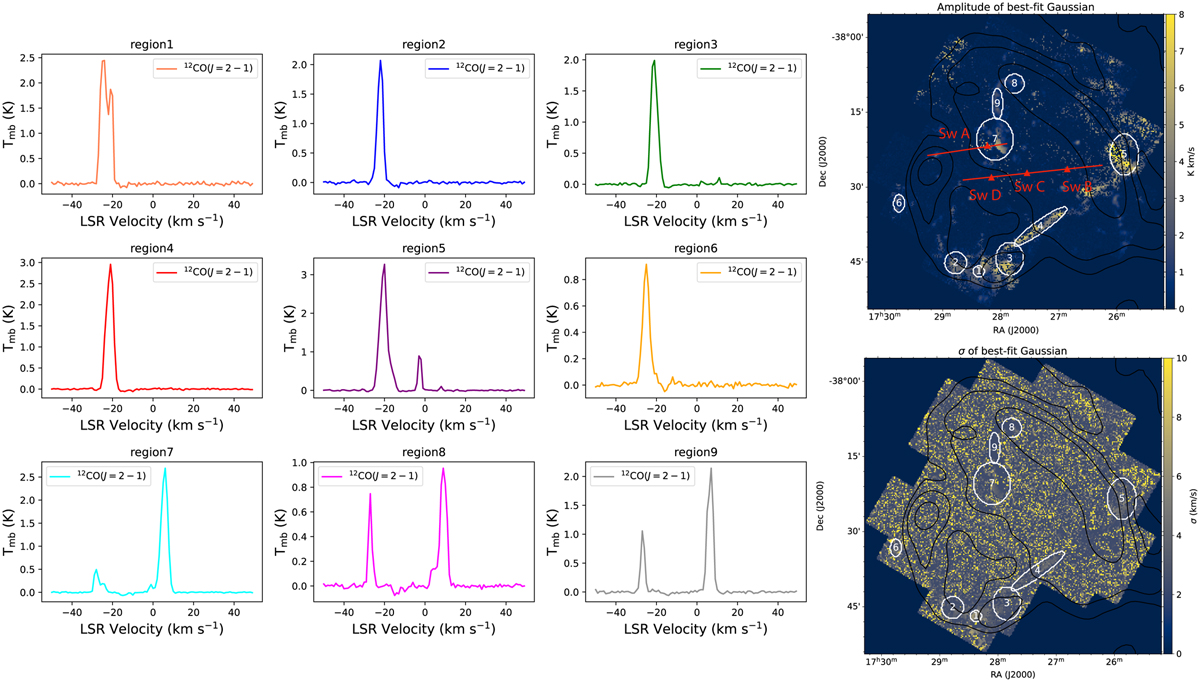
Fig. 9
Download original image
Properties of the 12CO (J = 2−1) emission towards G 350.0-2.0. Left: emission lines for a selection of regions (labelled in the right-hand-side maps) in G 350.0-2.0. The asymmetrical wings in regions 5 and 6 hint at the possibility of interaction, but there seems to be no evidence of shocks from broadened lines in any of the regions. Right: best-fit amplitude (top) and standard deviation (bottom) after fitting a Gaussian function to each pixel in the data cube. The lines in red on the amplitude plot correspond to the two position-velocity slices shown in Fig. 10. The overlaid contours are from the 88 MHz GLEAM image of G 350.0-2.0 (Hurley-Walker et al. 2019).
Current usage metrics show cumulative count of Article Views (full-text article views including HTML views, PDF and ePub downloads, according to the available data) and Abstracts Views on Vision4Press platform.
Data correspond to usage on the plateform after 2015. The current usage metrics is available 48-96 hours after online publication and is updated daily on week days.
Initial download of the metrics may take a while.