Fig. 8
Download original image
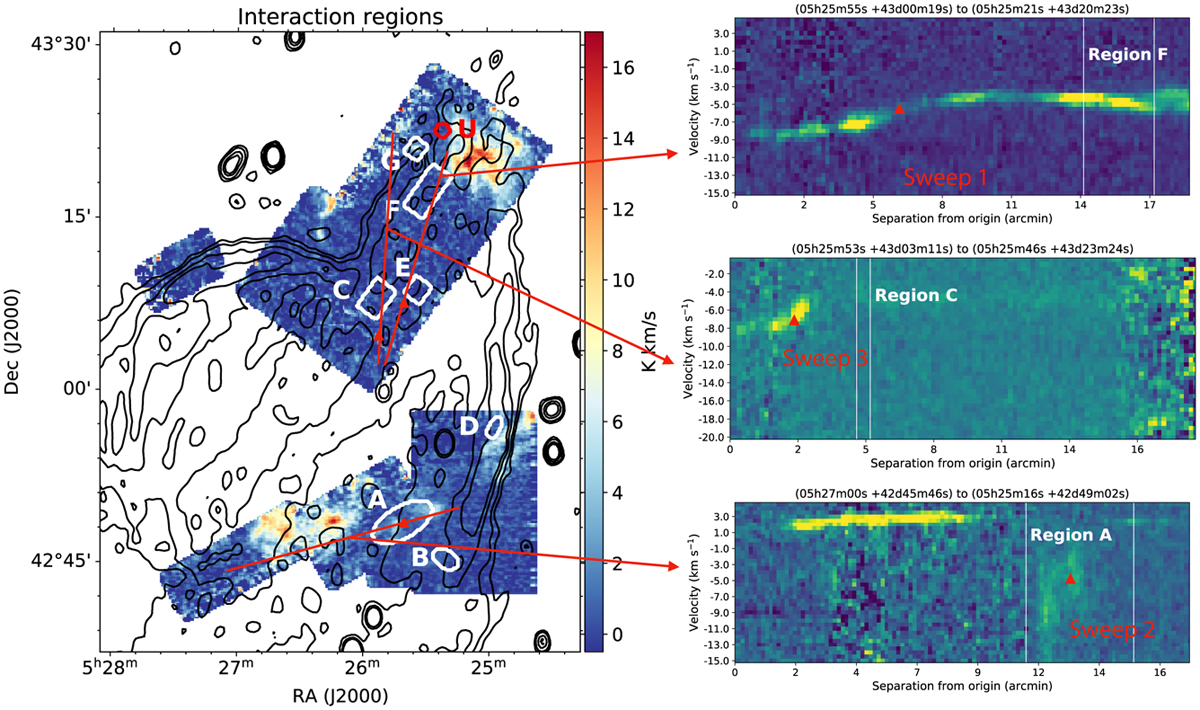
Position-velocity diagrams for three cuts along the VRO 42.05.01 12CO (J = 1−0) data cube. Each of the cuts is shown as a red line over the integrated molecular emission map, and the locations of the sweeps, where the bright molecular emission smoothly changes velocity channels, are shown as red triangles both in the map and in the position-velocity diagrams. Only Sweep 2 is related to a shock heated feature (Region A). Sweep 1 was identified in Arias et al. (2019a).
Current usage metrics show cumulative count of Article Views (full-text article views including HTML views, PDF and ePub downloads, according to the available data) and Abstracts Views on Vision4Press platform.
Data correspond to usage on the plateform after 2015. The current usage metrics is available 48-96 hours after online publication and is updated daily on week days.
Initial download of the metrics may take a while.