Fig. 7
Download original image
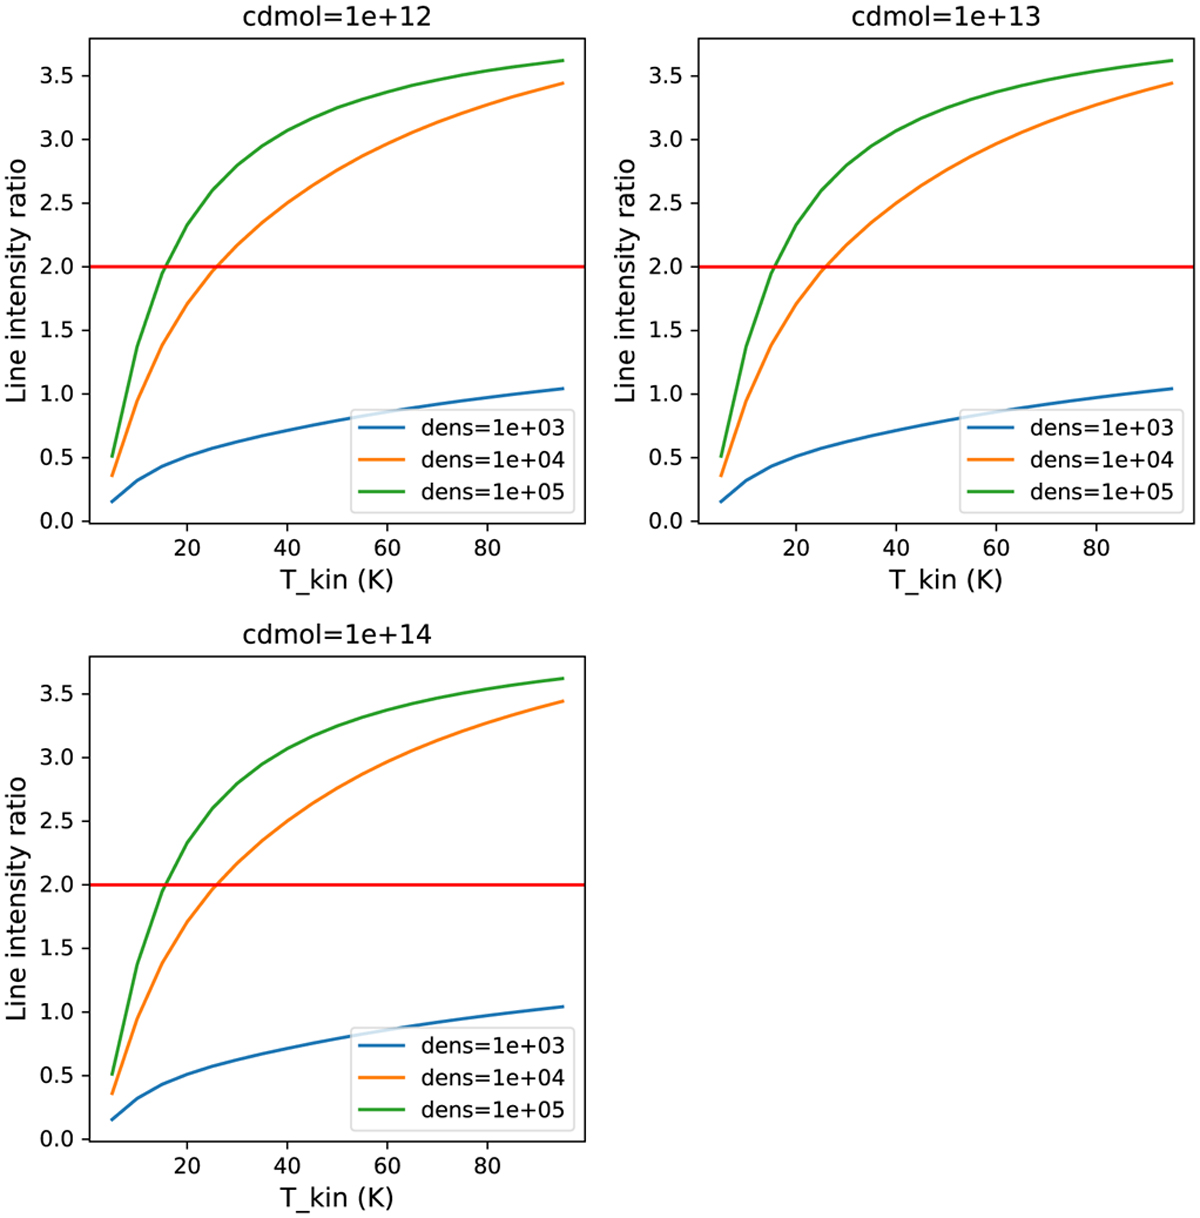
Results from the radiative modelling of the12 CO (J = 2−1) and 12CO (J = 1−0) transitions with RADEX. The ratio between the 12CO (J = 2−1) and 12CO (J = 1−0) line peaks ratio is plotted as a function of kinetic temperature (T_kin) for different values of H2 density (dens, in cm−3) and column density (cdmol, in cm−2). A horizontal line for ratio equals to 2 indicates the conditions of the molecular gas in the regions A, B, and D around VRO 42.05.01.
Current usage metrics show cumulative count of Article Views (full-text article views including HTML views, PDF and ePub downloads, according to the available data) and Abstracts Views on Vision4Press platform.
Data correspond to usage on the plateform after 2015. The current usage metrics is available 48-96 hours after online publication and is updated daily on week days.
Initial download of the metrics may take a while.