Fig. 5
Download original image
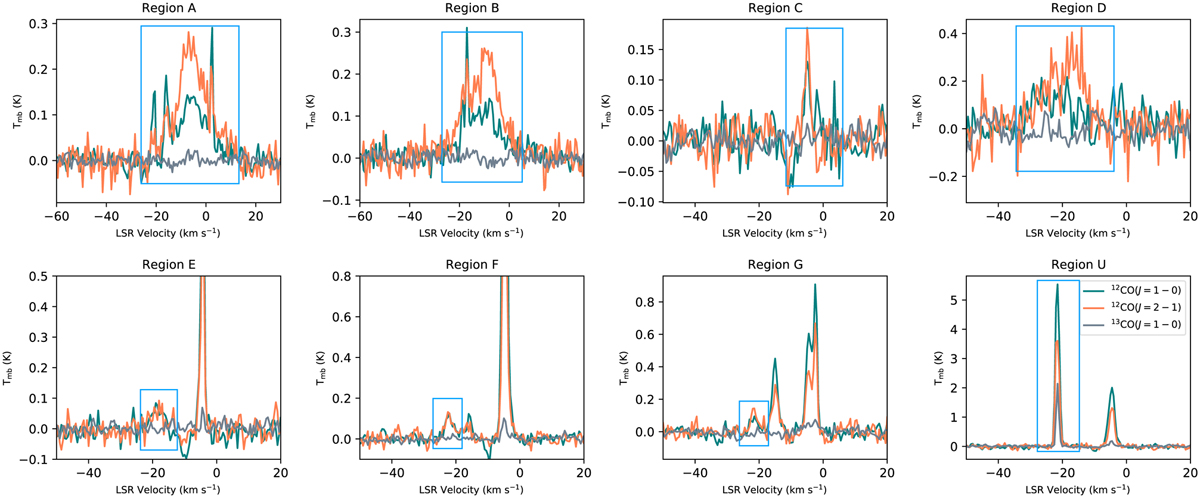
Regions of the disturbed molecular material around VRO 42.05.01. Integrated spectra for each of the regions described in Table 1. The details given in the table, for each region, correspond to the line component highlighted in the blue box. We note that regions A, B, and D show the strongest evidence for interaction with their broad velocity dispersion (FWHM) and enhanced 12CO (J = 2−1) to 12CO (J =1−0) emission. Region U is shown here for comparison, as an example of undisturbed emission. The location of the regions is shown in Fig. 6. The legend in the bottom, right plot is common to all plots.
Current usage metrics show cumulative count of Article Views (full-text article views including HTML views, PDF and ePub downloads, according to the available data) and Abstracts Views on Vision4Press platform.
Data correspond to usage on the plateform after 2015. The current usage metrics is available 48-96 hours after online publication and is updated daily on week days.
Initial download of the metrics may take a while.