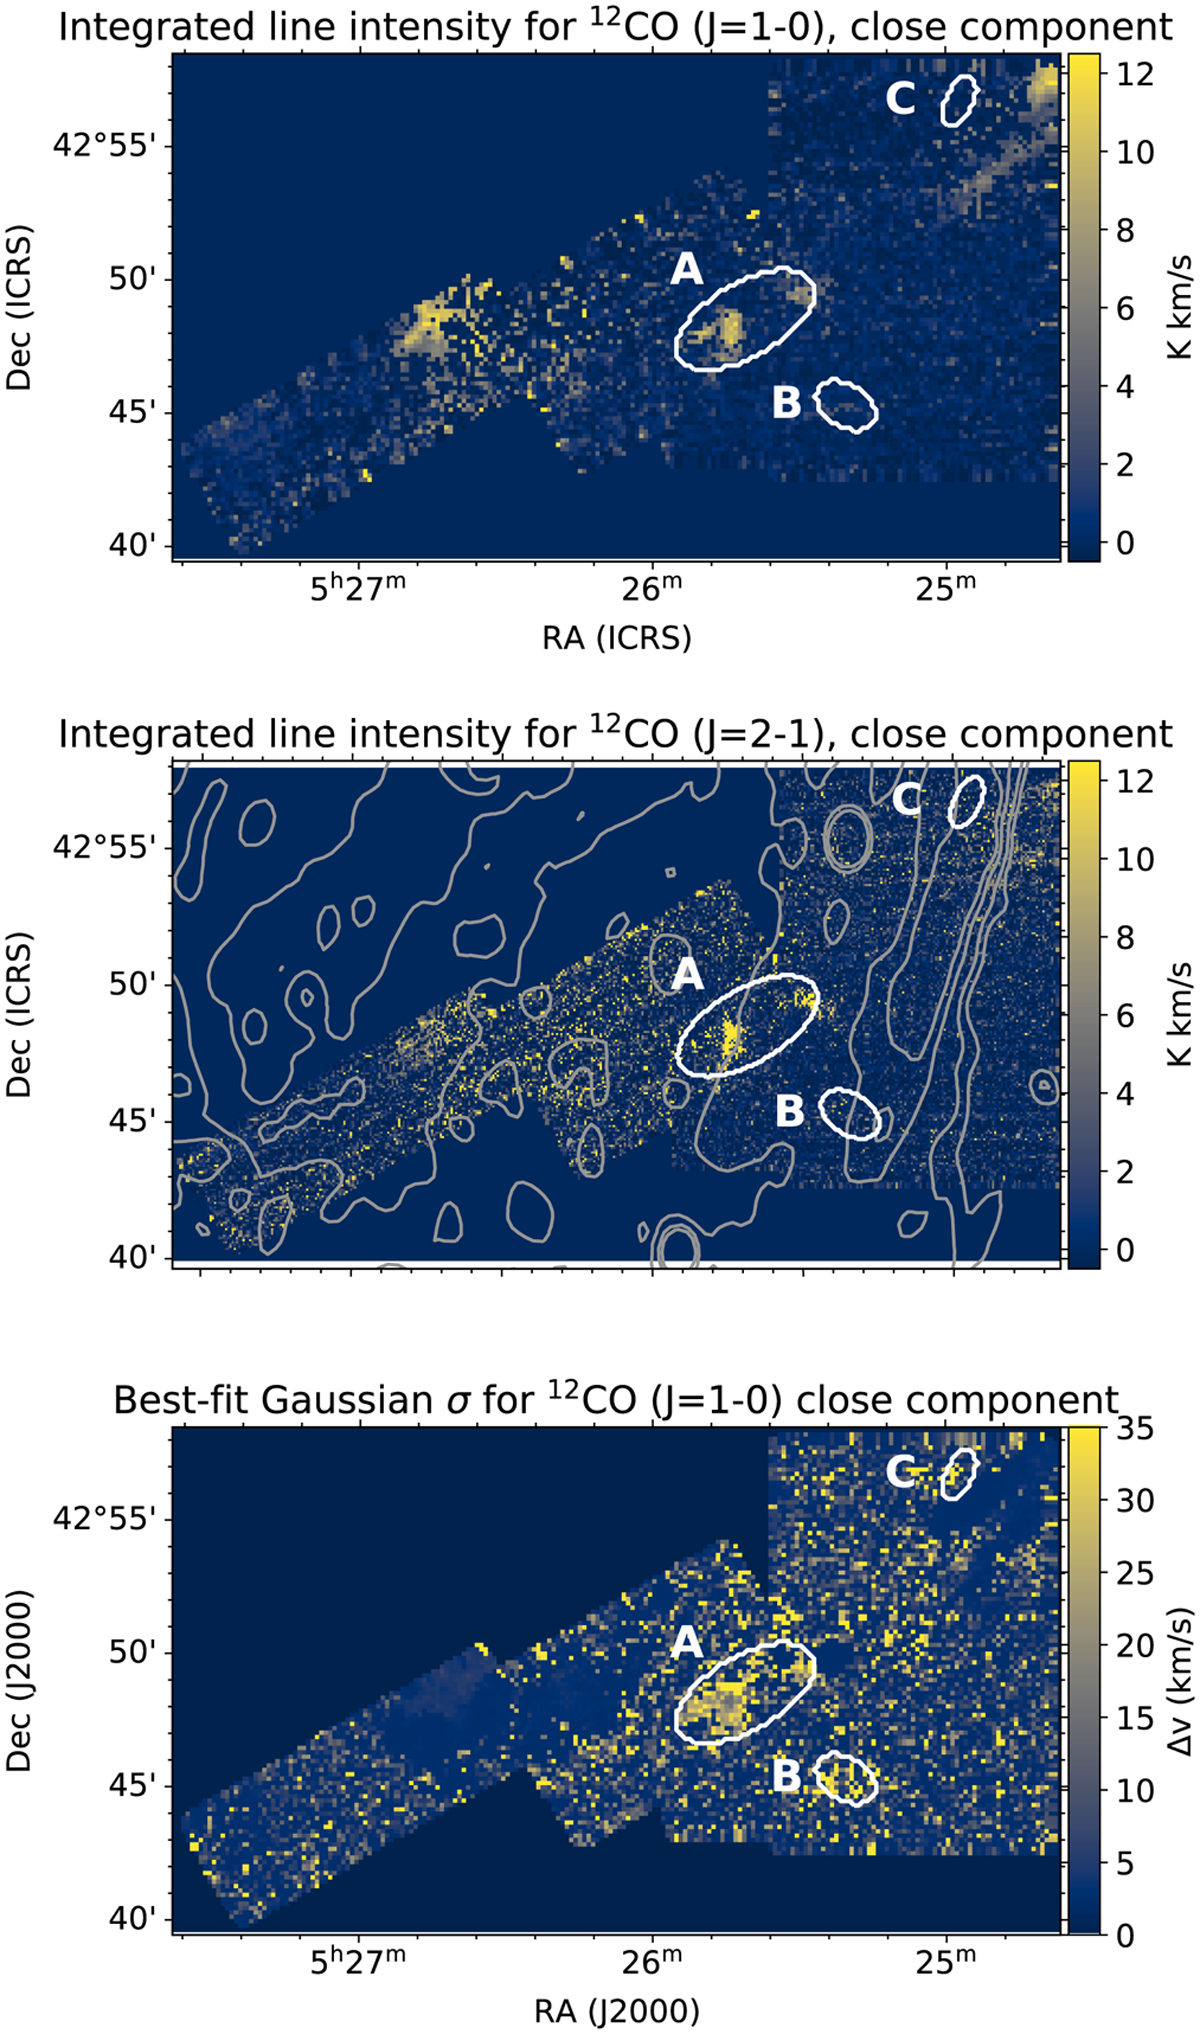
Fig. 4
Download original image
Properties of the 12CO (J = 1−0) close emission component. Top and middle: integrated line intensities per pixel in the close component for the 12CO (J = 1−0) and the 12CO (J = 2−1) data, respectively, for the SNR VRO 42.05.01. The regions indicated in white mark the locations where the molecular gas is heated. Bottom: best-fit result for the standard deviation after fitting a Gaussian to the close emission component.
Current usage metrics show cumulative count of Article Views (full-text article views including HTML views, PDF and ePub downloads, according to the available data) and Abstracts Views on Vision4Press platform.
Data correspond to usage on the plateform after 2015. The current usage metrics is available 48-96 hours after online publication and is updated daily on week days.
Initial download of the metrics may take a while.