Fig. 3
Download original image
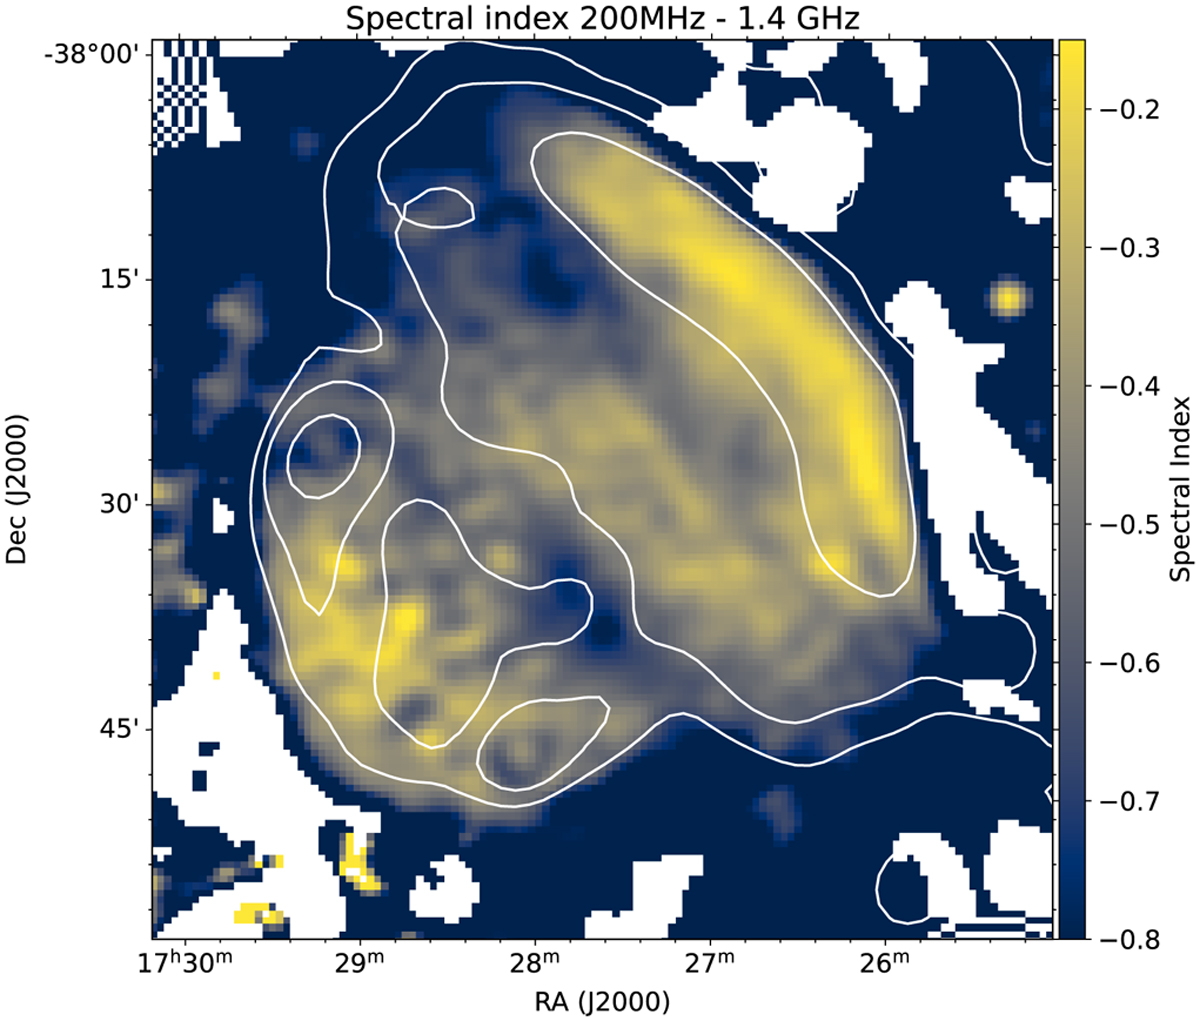
Spectral index map of G 350.0-2.0 made from the 1.4 GHz map in Gaensler (1998) and the GLEAM 200 MHz map (Hurley-Walker et al. 2019). The overlaid contours are from the 88 MHz GLEAM image of G 350.0-2.0 (Hurley-Walker et al. 2019). The visibilities are not uv-matched, nor have the point sources been subtracted, but both images are sensitive to all scales of emission for this source. The integrated spectral index value between these two frequencies is α = −0.4.
Current usage metrics show cumulative count of Article Views (full-text article views including HTML views, PDF and ePub downloads, according to the available data) and Abstracts Views on Vision4Press platform.
Data correspond to usage on the plateform after 2015. The current usage metrics is available 48-96 hours after online publication and is updated daily on week days.
Initial download of the metrics may take a while.