Fig. 2
Download original image
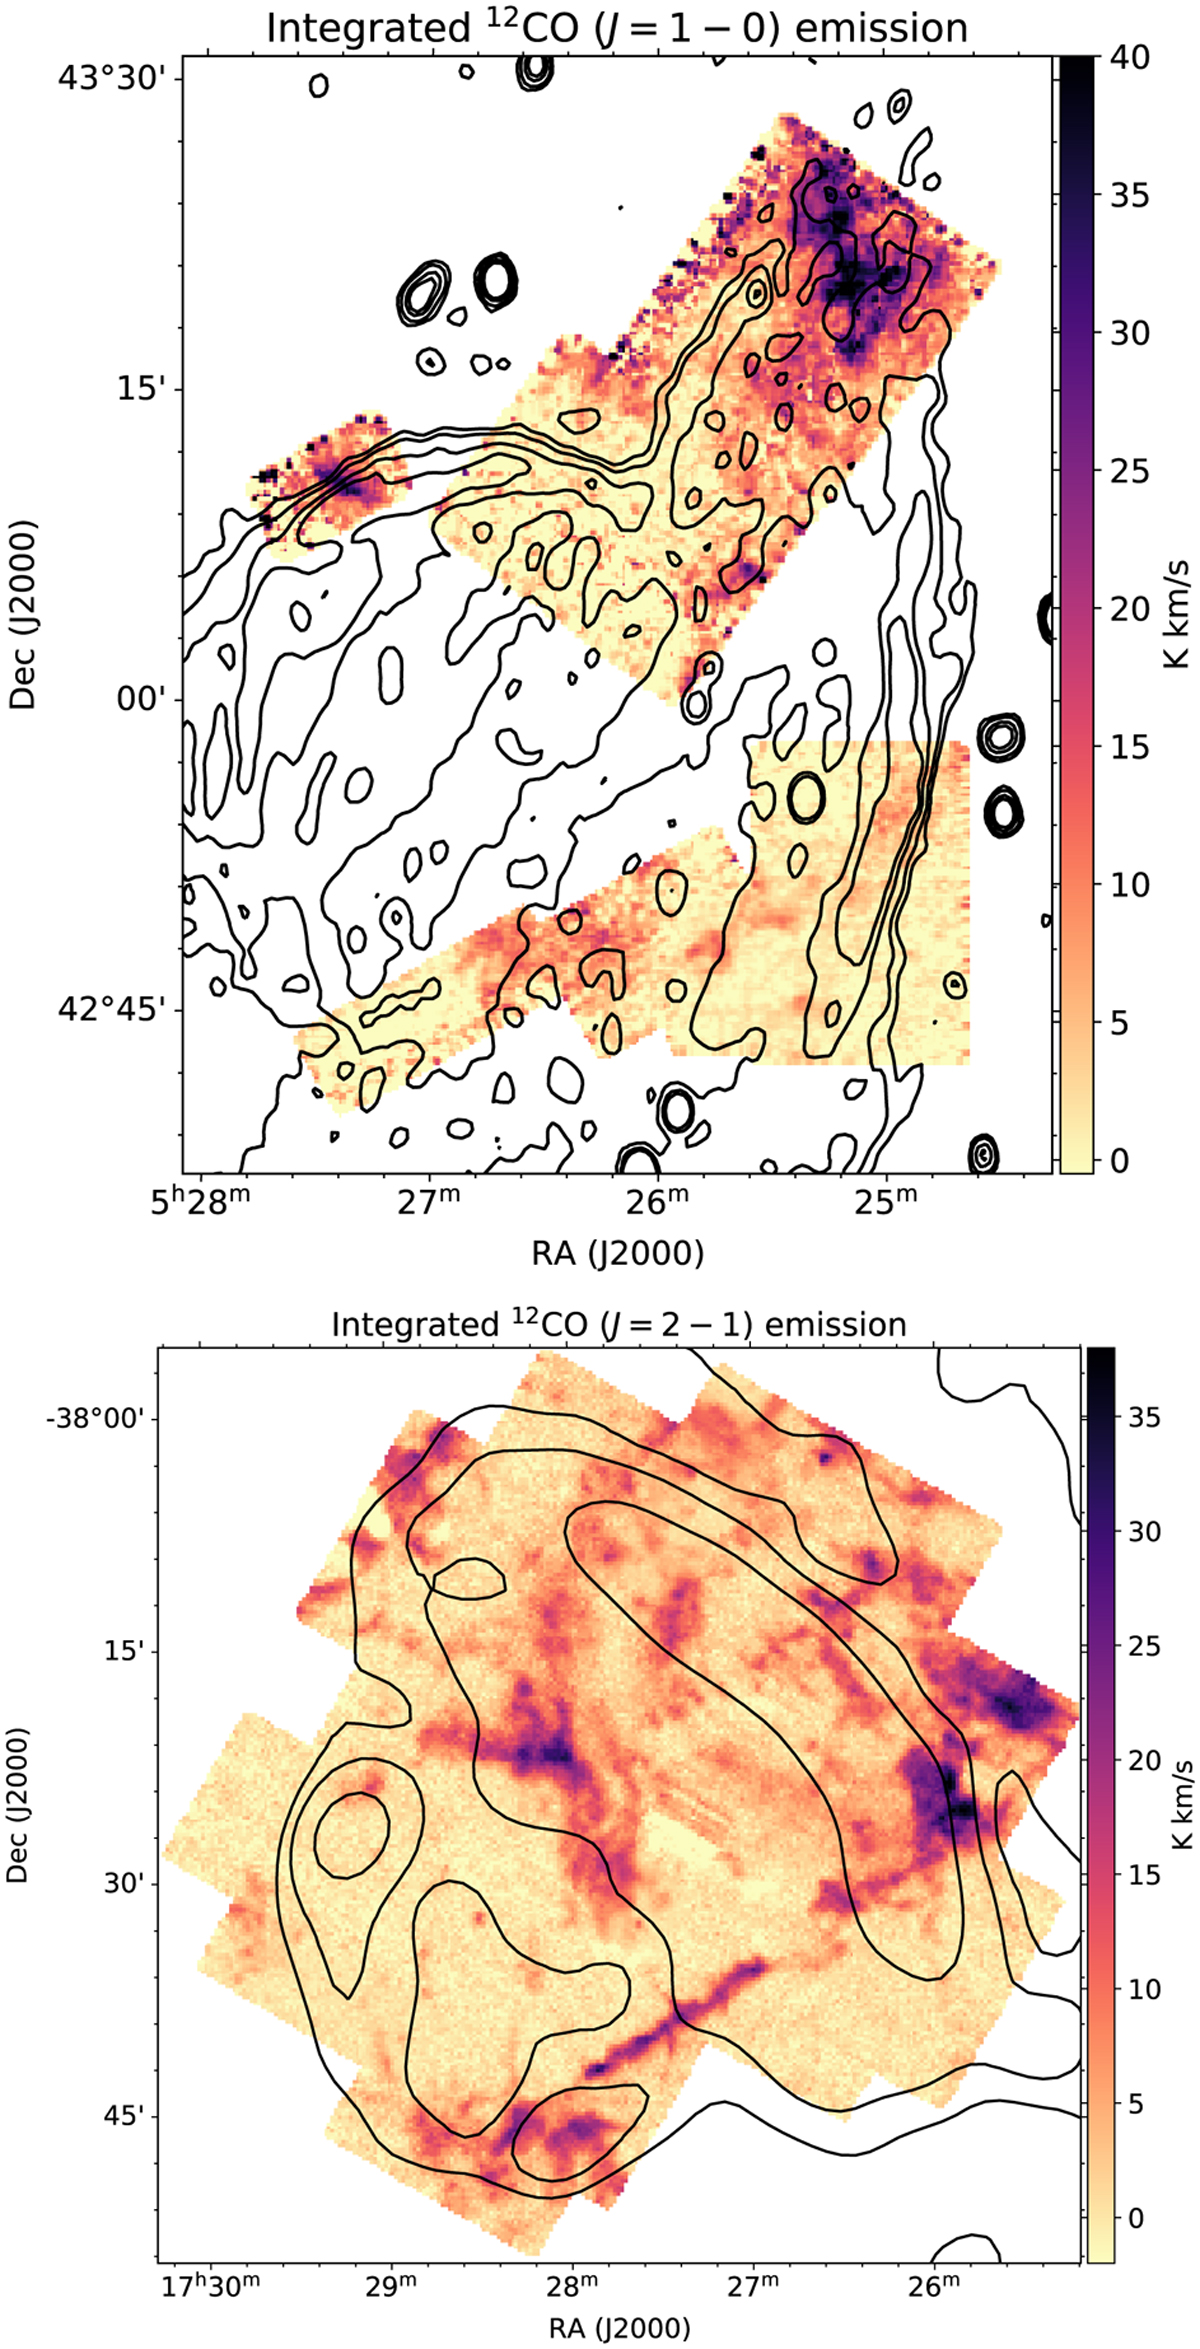
Molecular observations towards the shell- and wing-shaped SNRs. Top: footprint of the IRAM observations of VRO 42.05.01, including the observations from this work (the continuous area in the southern half of this map) and those in Arias et al. (2019a, the two separate regions in the northern half). The velocity-integrated emission is shown for the 12CO (J = 1−0) transition. The contours are from the 1420 MHz Canadian Galactic Plane Survey image of VRO 42.05.01 (Wright et al. 2010). Bottom: integrated spectra for the APEX G 350.02.0 observations, 12CO (J = 2−1) transition. The radio contours are from the 88 MHz GLEAM image of G 350.0-2.0 (Hurley-Walker et al. 2019).
Current usage metrics show cumulative count of Article Views (full-text article views including HTML views, PDF and ePub downloads, according to the available data) and Abstracts Views on Vision4Press platform.
Data correspond to usage on the plateform after 2015. The current usage metrics is available 48-96 hours after online publication and is updated daily on week days.
Initial download of the metrics may take a while.