Fig. 11
Download original image
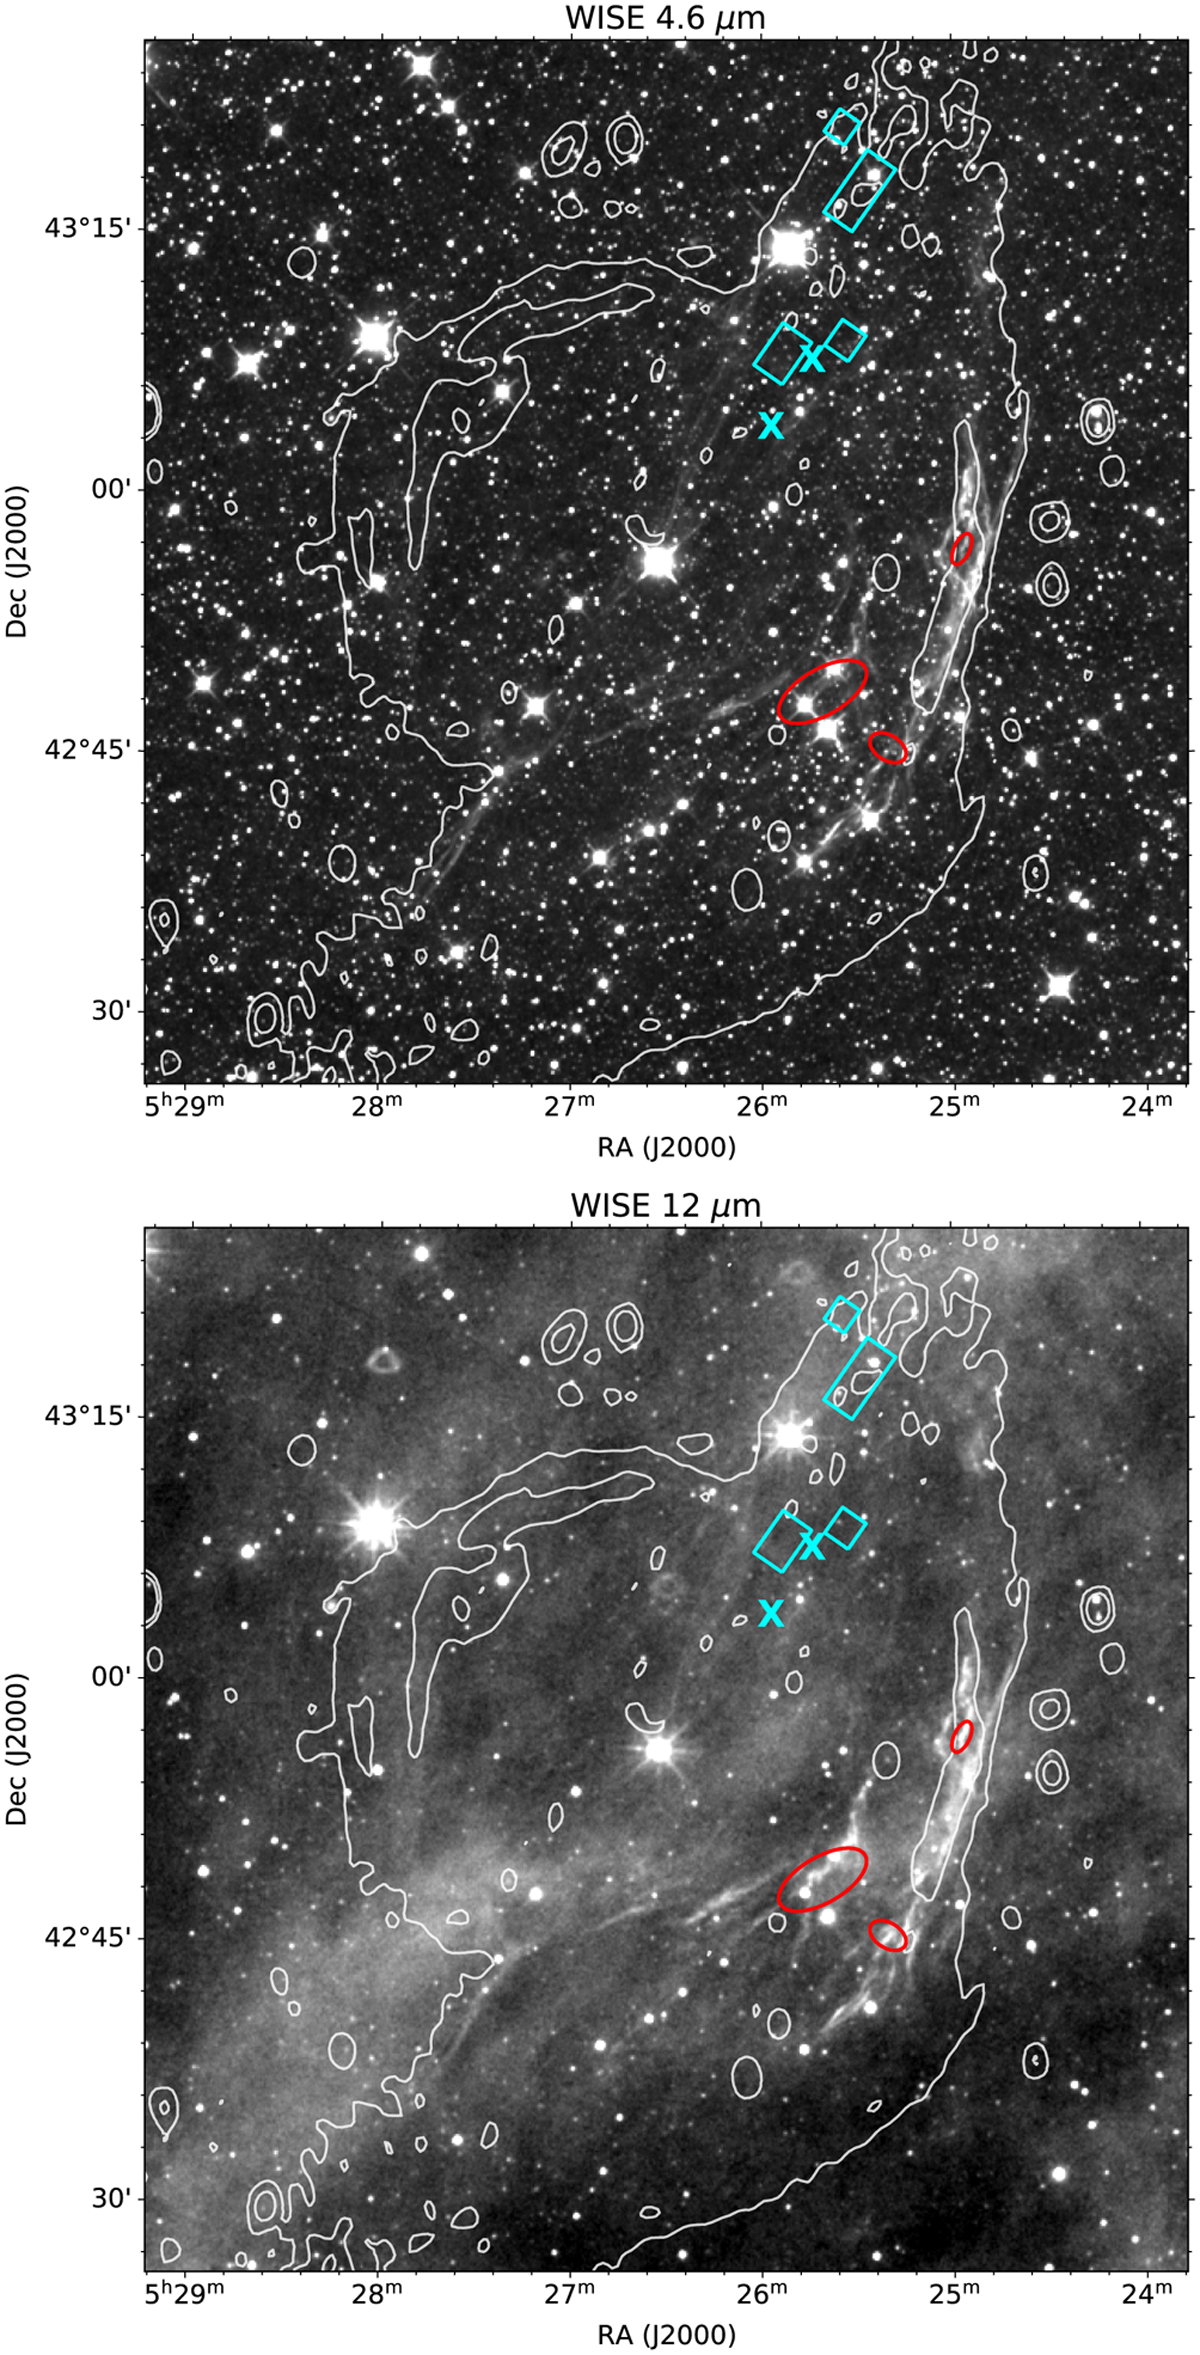
Infrared emission from VRO 42.05.01 at 4.6 µm (top) and 12 µm (bottom), with the regions identified in Fig. 6 overlaid. The sweeps in position-velocity space from Fig. 8 are indicated with an ×. The features in red are those we believe are due to the SNR shock, and (some or all) those in cyan could be due to a pre-SN stellar wind. We note that the regions of swept-up mass occur along the shell of VRO 42.05.01. Both maps are taken from the WISE archive (Wright et al. 2010).
Current usage metrics show cumulative count of Article Views (full-text article views including HTML views, PDF and ePub downloads, according to the available data) and Abstracts Views on Vision4Press platform.
Data correspond to usage on the plateform after 2015. The current usage metrics is available 48-96 hours after online publication and is updated daily on week days.
Initial download of the metrics may take a while.