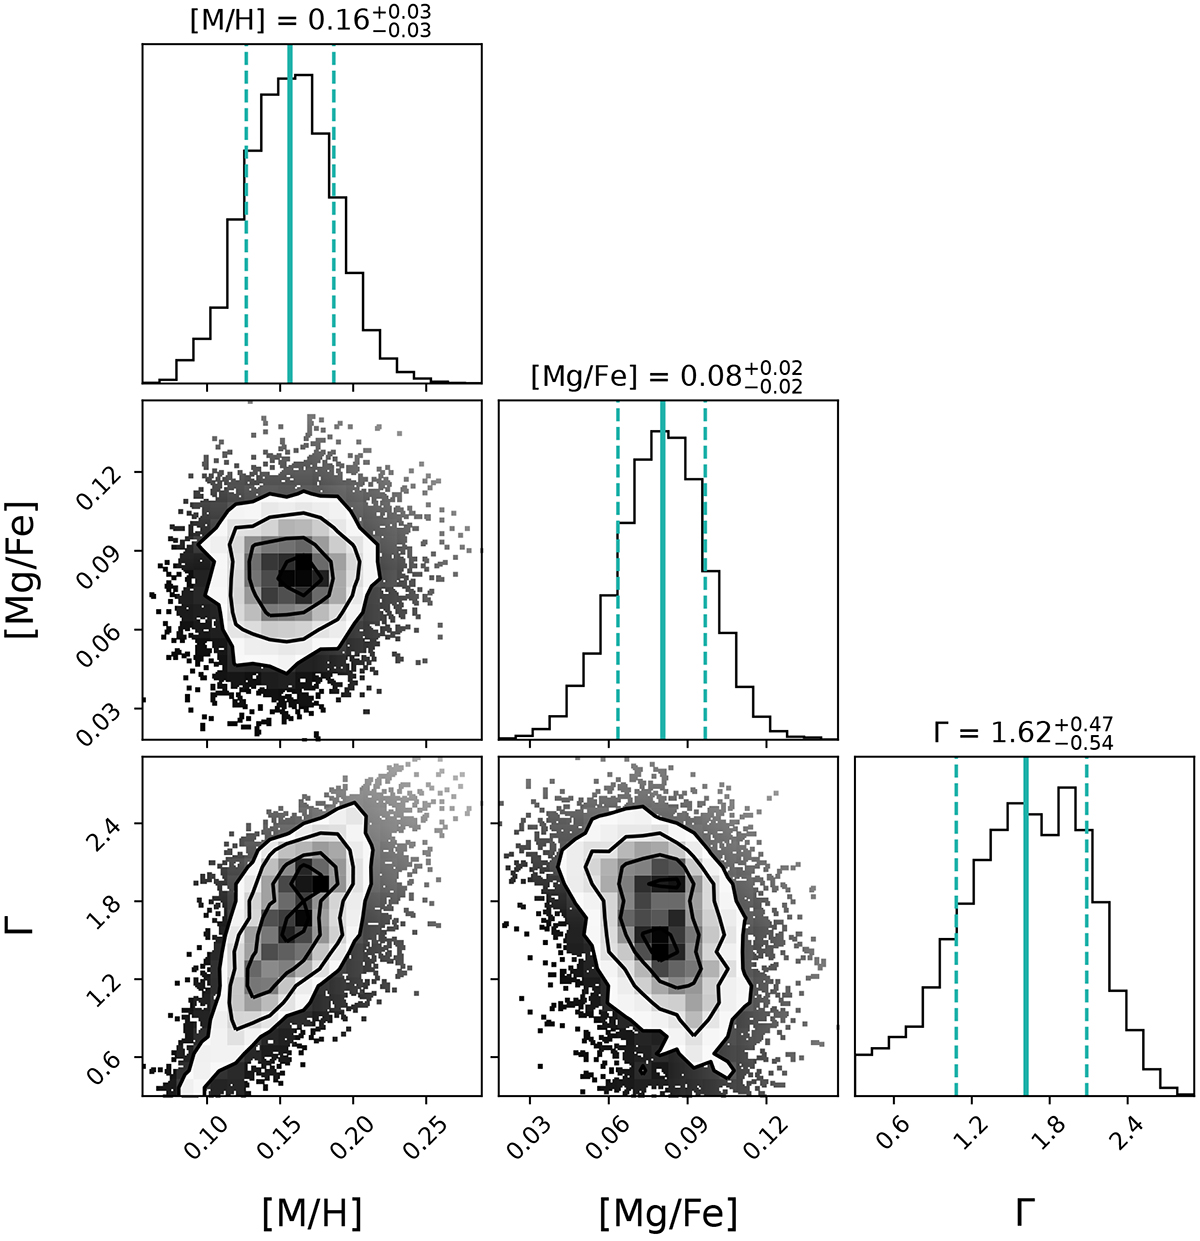
Fig. 7.
Download original image
Full posterior distribution for the three main stellar population parameters measured during the second step, namely total metallicity, [Mg/Fe], and IMF slope Γ, for the observed spectrum shown in Fig. 6. The green solid lines indicate the median of the distribution, while dashed vertical lines mark the 16th and 84th percentiles. Our fitting approach is able to capture and successfully break the degeneracies of the inversion problem even when fitting stellar populations characterized by an extended SFH.
Current usage metrics show cumulative count of Article Views (full-text article views including HTML views, PDF and ePub downloads, according to the available data) and Abstracts Views on Vision4Press platform.
Data correspond to usage on the plateform after 2015. The current usage metrics is available 48-96 hours after online publication and is updated daily on week days.
Initial download of the metrics may take a while.