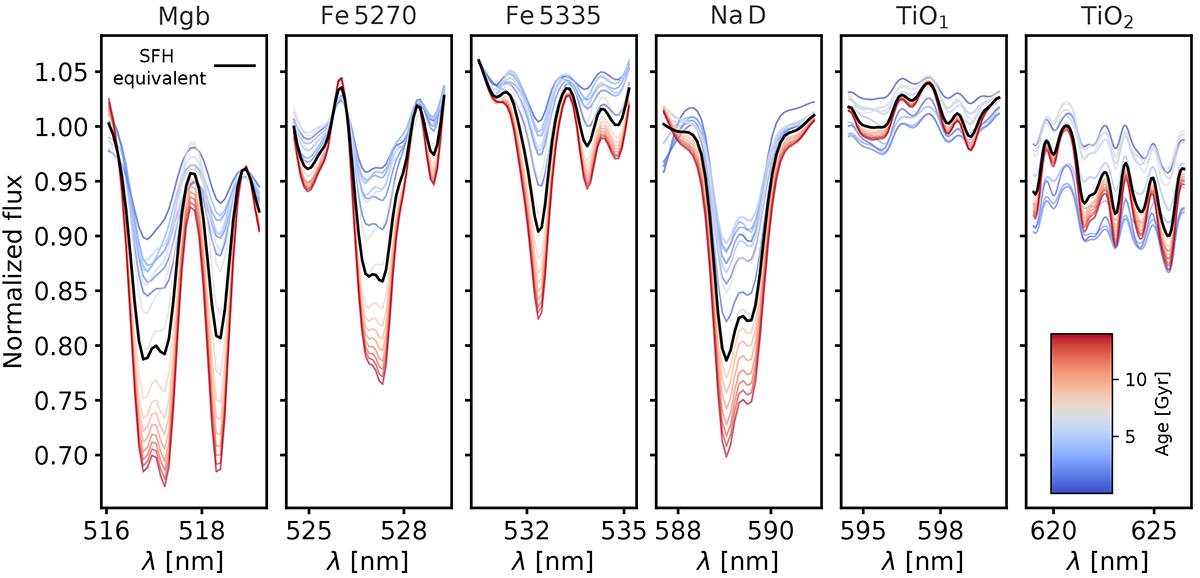
Fig. 5.
Download original image
Spectral dependence on the SFH. Colored lines illustrate the age dependence of the six spectral features included in our analysis. The solid black line shows the SFH-equivalent prediction resulting from weighting each SSP model according to the measured SFH. We note that the continuum of each model has been normalized to better represent the flux of the different SSPs. However, during the fitting process the normalization is only applied to the SFH-equivalent model prediction (i.e., the black line).
Current usage metrics show cumulative count of Article Views (full-text article views including HTML views, PDF and ePub downloads, according to the available data) and Abstracts Views on Vision4Press platform.
Data correspond to usage on the plateform after 2015. The current usage metrics is available 48-96 hours after online publication and is updated daily on week days.
Initial download of the metrics may take a while.