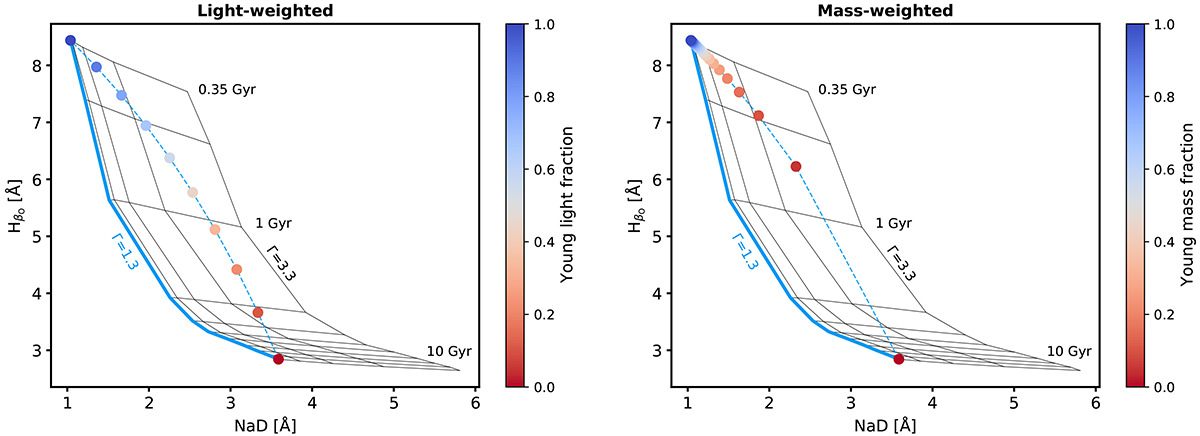
Fig. 4.
Download original image
HβO vs. NaD index–index diagram. Gray grids show the MILES predictions at the native resolution of the models (2.51 Å) and solar metallicity for different ages and IMF slopes, as indicated by the labels. Blue solid lines highlight the age variation for a Salpeter IMF. Dashed blue lines and filled circles track the range of expected values for a composite stellar population of two SSP models (14 Gyr and 0.35 Gyr), both of them with a Milky Way-like IMF. Symbols are color-coded according to the light (left panel) and mass (right panel) fraction associated to the young SSP model. This simplified yet realistic example shows how the best-fitting SSP solution fails to recover the true value of Γ = 1.3 when applied to composite stellar populations, which could result in unrealistically high IMF slope values (Γ ∼ 3.3).
Current usage metrics show cumulative count of Article Views (full-text article views including HTML views, PDF and ePub downloads, according to the available data) and Abstracts Views on Vision4Press platform.
Data correspond to usage on the plateform after 2015. The current usage metrics is available 48-96 hours after online publication and is updated daily on week days.
Initial download of the metrics may take a while.