Fig. 14
Download original image
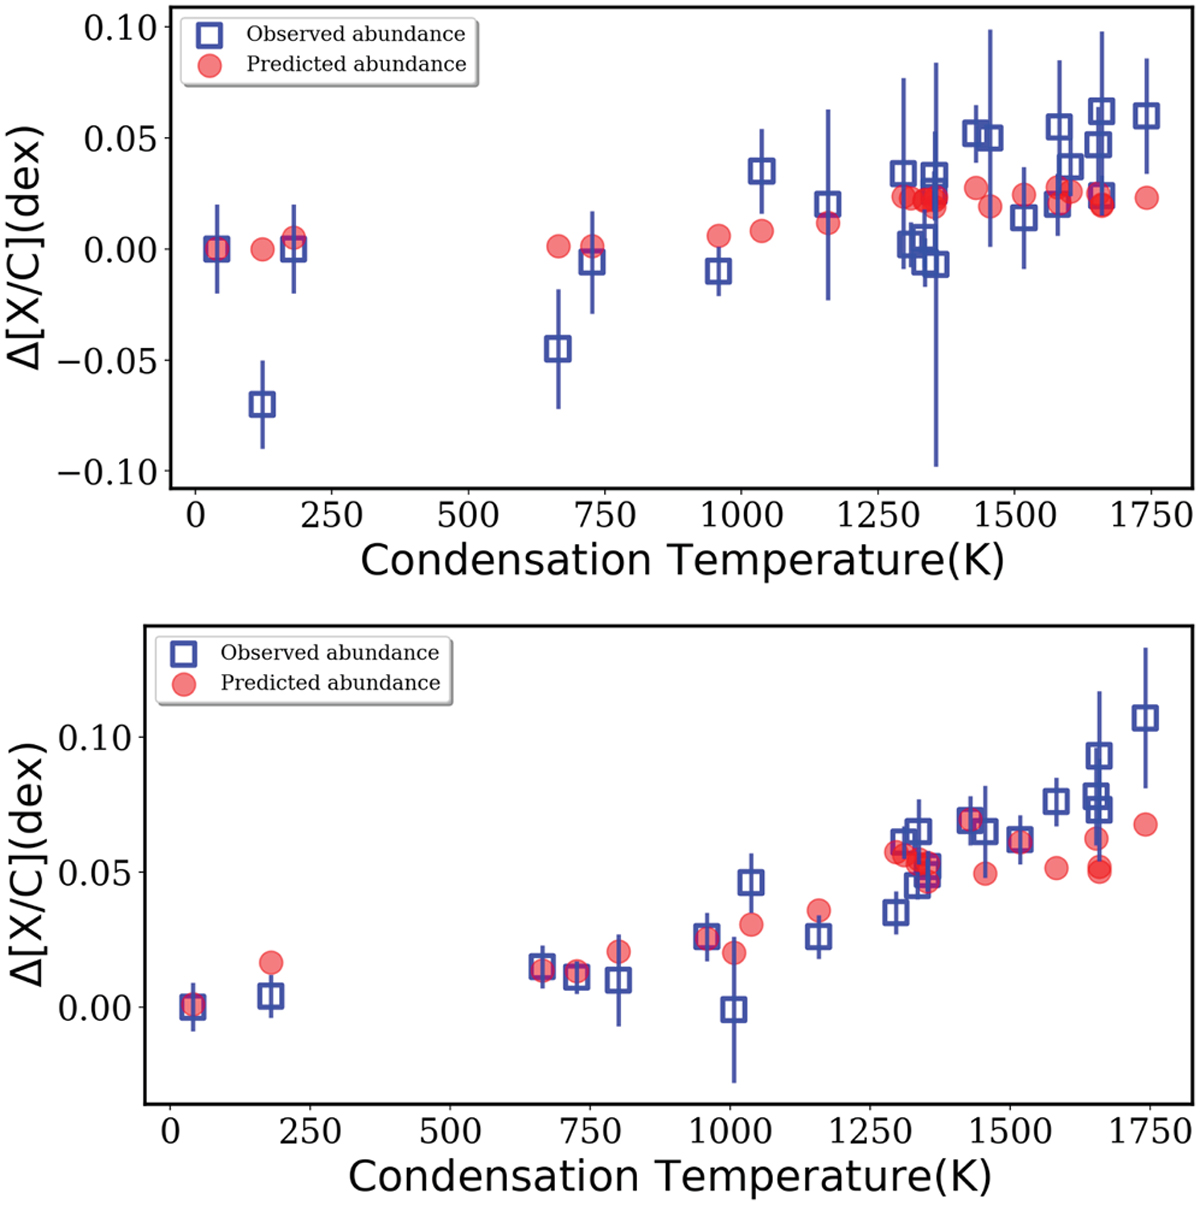
Comparison of the abundances of XO-2N relative to XO-2S (open blue squares) as a function of the dust condensation temperature, and the predicted abundances (red filled circles) estimated from a planetary engulfment scenario. Squares in the upper and lower panels represent the results by Biazzo et al. (2015) and Ramírez et al. (2015), respectively.
Current usage metrics show cumulative count of Article Views (full-text article views including HTML views, PDF and ePub downloads, according to the available data) and Abstracts Views on Vision4Press platform.
Data correspond to usage on the plateform after 2015. The current usage metrics is available 48-96 hours after online publication and is updated daily on week days.
Initial download of the metrics may take a while.