Fig. 13
Download original image
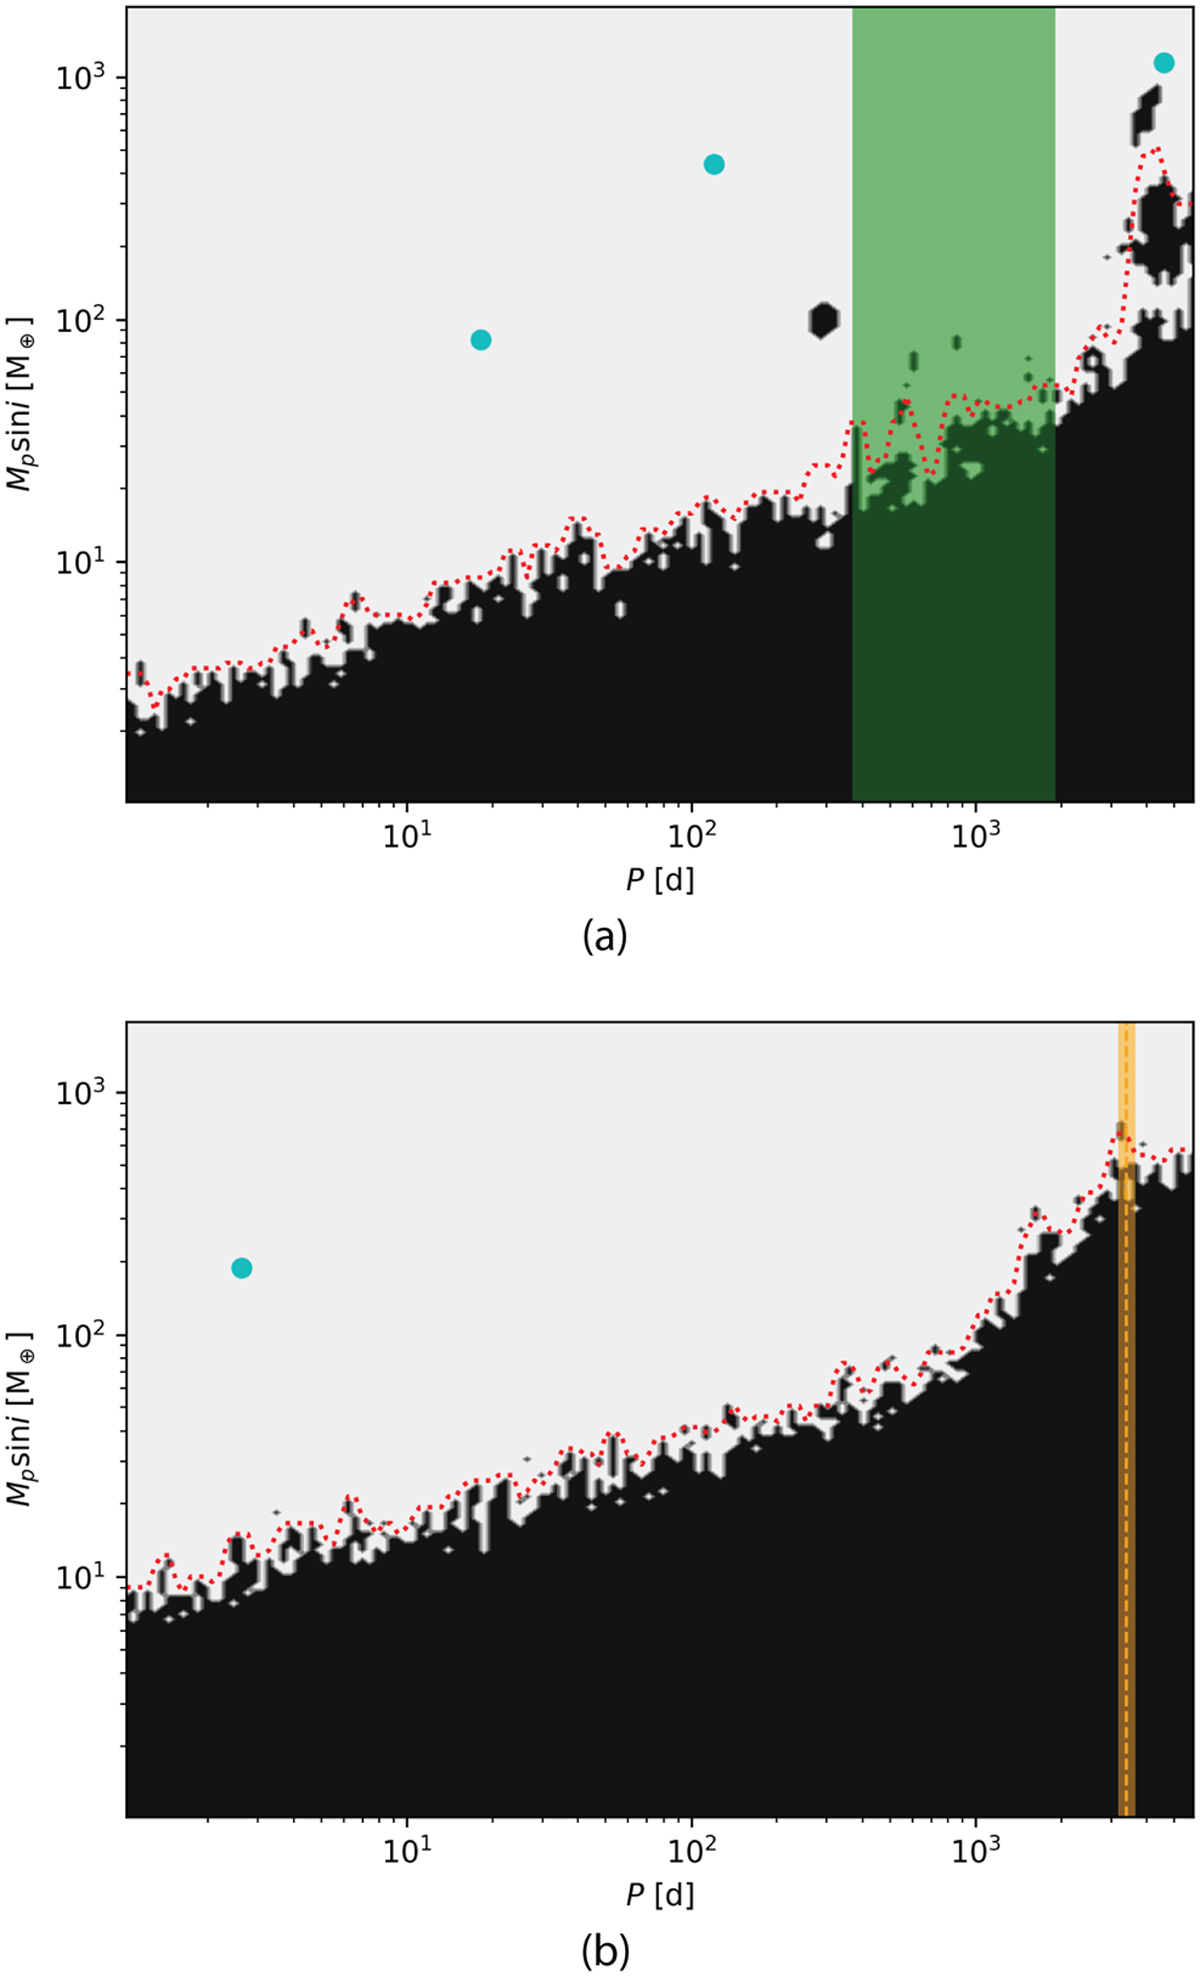
Detection function maps of the RV time series of XO-2S (upper panel) and XO-2N (lower panel). The white part corresponds to the area in the period-minimum mass space where additional signals could be detected if present in the data, while the black region corresponds to the area where the detection probability is negligible. The red dotted line marks the 95% detection threshold. The cyan dots show the positions of the planets orbiting the two stars. The green shaded area in the upper panel denotes the stability region discussed in Sect. 4.5. The orange dashed line and shaded band in the lower panel mark the period and 1σ uncertainty of the activity cycle as modeled in Sect. 5.5.
Current usage metrics show cumulative count of Article Views (full-text article views including HTML views, PDF and ePub downloads, according to the available data) and Abstracts Views on Vision4Press platform.
Data correspond to usage on the plateform after 2015. The current usage metrics is available 48-96 hours after online publication and is updated daily on week days.
Initial download of the metrics may take a while.