Open Access
Fig. 1
Download original image
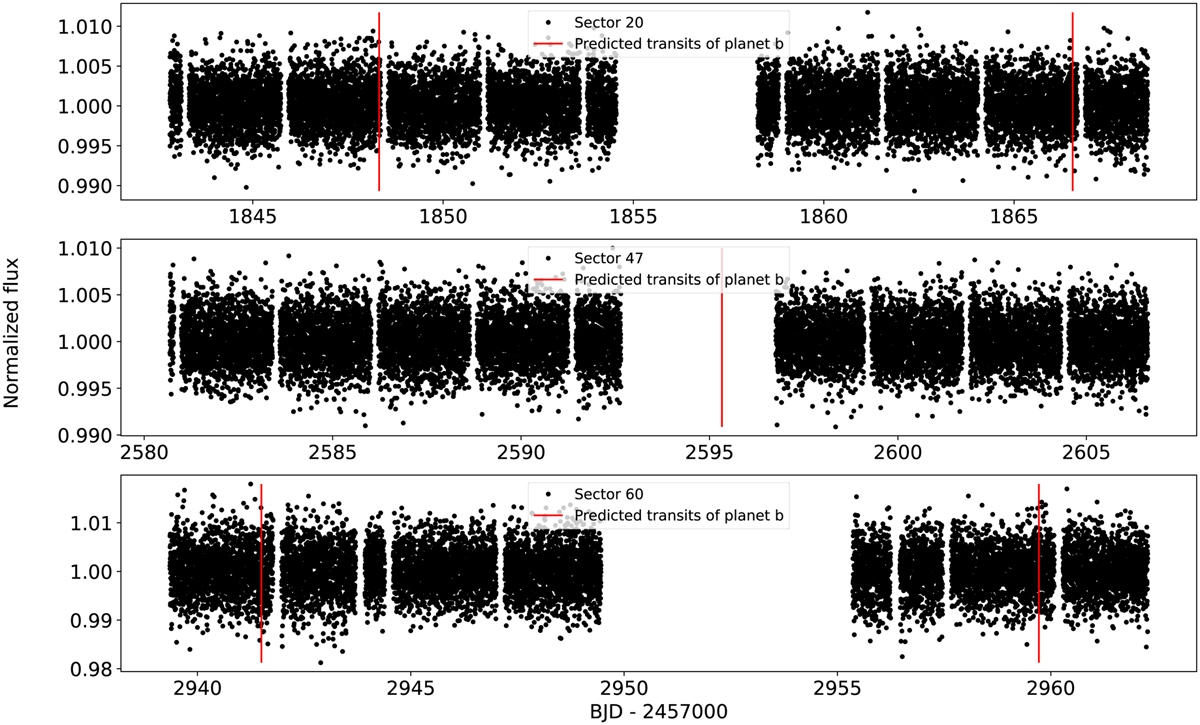
TESS light curves of XO-2S after removing outliers above 4 σ, normalizing, correcting for dilution, and removing the transits of XO-2N b. The red bars indicate the predicted transits for planet b from RV results, as explained in Sect. 4.4.
Current usage metrics show cumulative count of Article Views (full-text article views including HTML views, PDF and ePub downloads, according to the available data) and Abstracts Views on Vision4Press platform.
Data correspond to usage on the plateform after 2015. The current usage metrics is available 48-96 hours after online publication and is updated daily on week days.
Initial download of the metrics may take a while.