Fig. D.1
Download original image
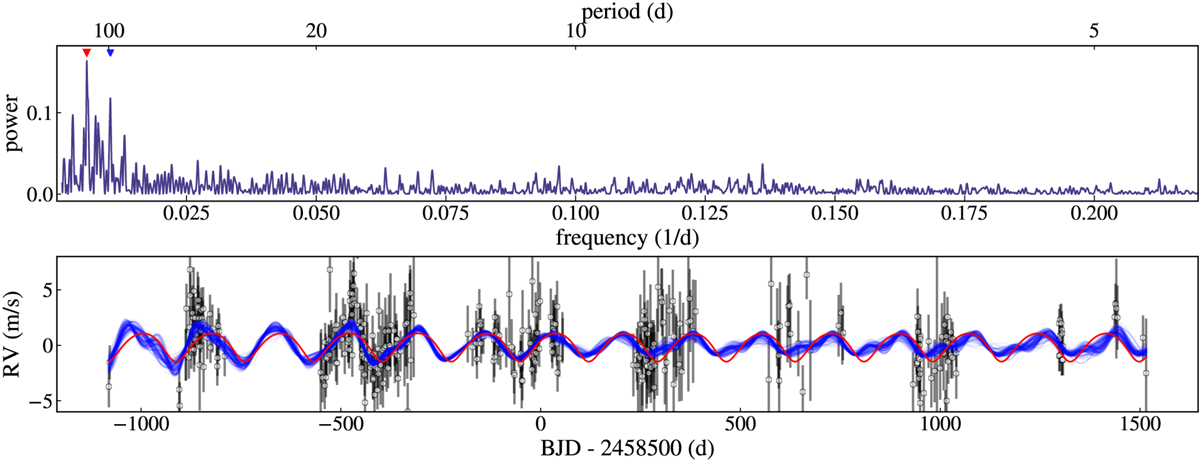
The noise model in frequency and time domain. Top: Periodogram of the correlated noise model of the best-fit of model I. The peri-odogram shows peaks both at 172 d (red) and the 96 d (blue) signal. Bottom: Comparison between the correlated noise model using draws from the posteriors of the hyperparameters for the dSHO kernel from model I (blue) and the best-fit Keplerian model for the 172 d signal from model E (red). The data points are the offset- and jitter-corrected measurements for all instruments where the contribution from planets b, c, and d have been subtracted.
Current usage metrics show cumulative count of Article Views (full-text article views including HTML views, PDF and ePub downloads, according to the available data) and Abstracts Views on Vision4Press platform.
Data correspond to usage on the plateform after 2015. The current usage metrics is available 48-96 hours after online publication and is updated daily on week days.
Initial download of the metrics may take a while.