Fig. 2
Download original image
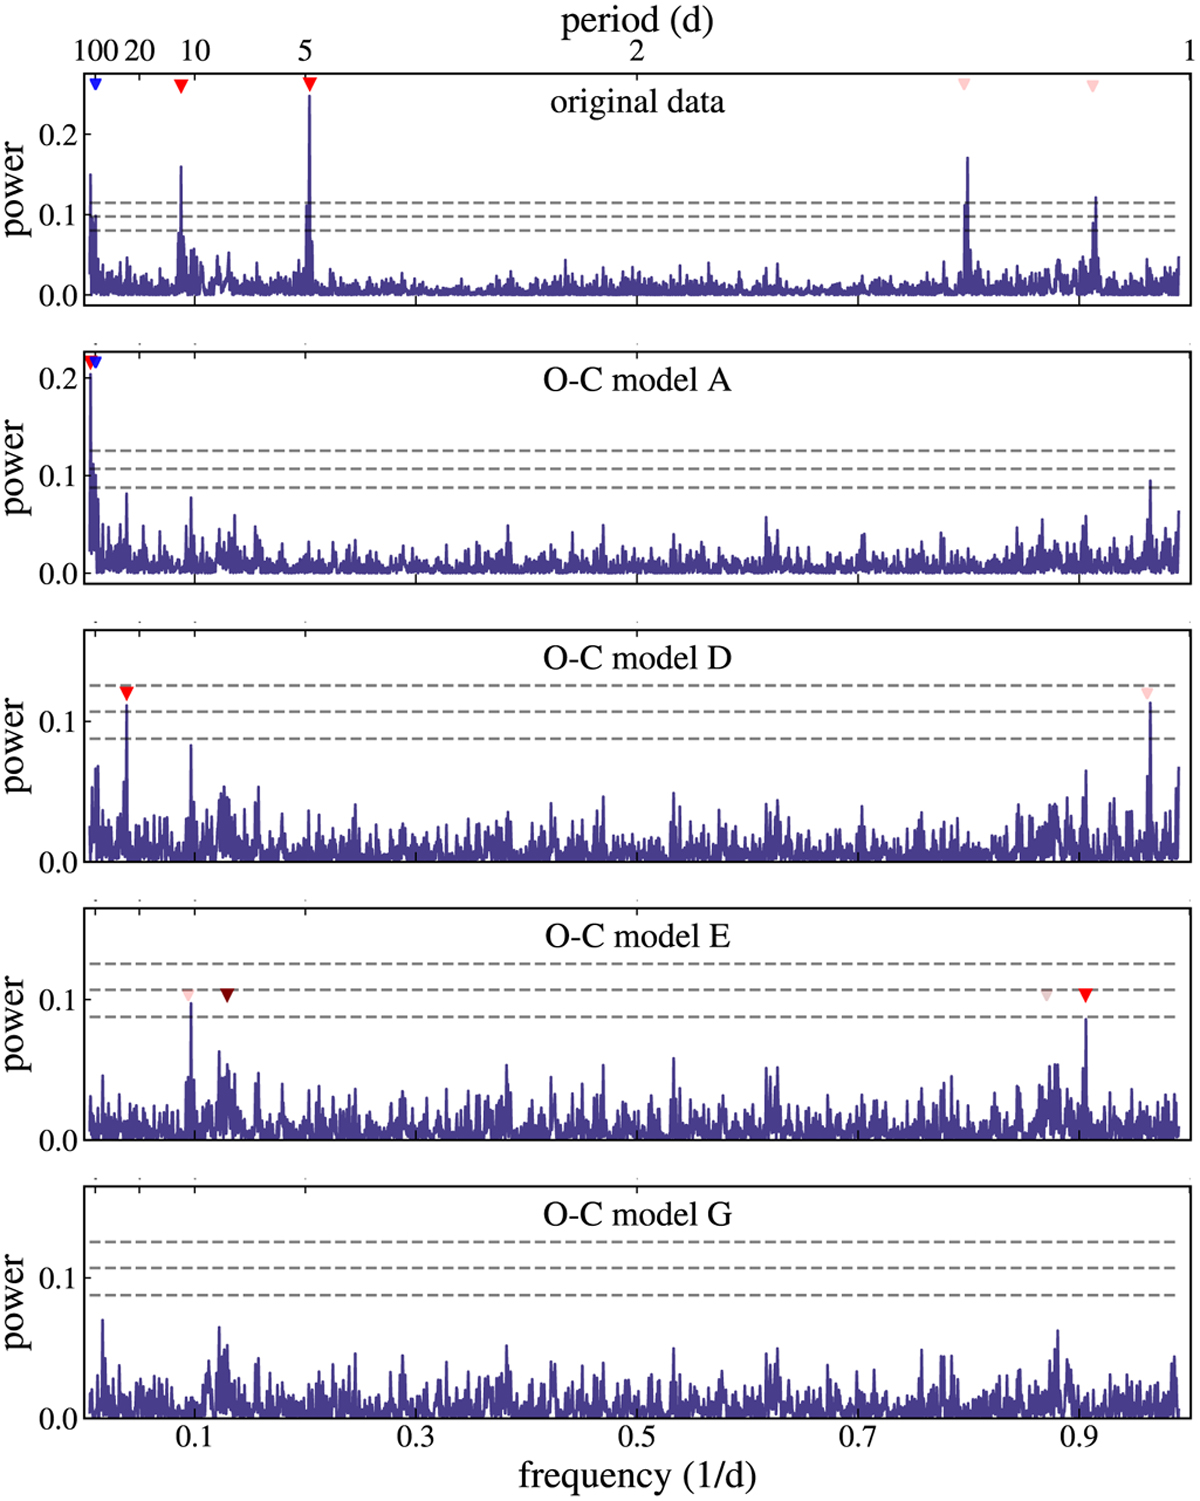
Periodogram of the CARMENES VIS data. From top to bottom: signals are subsequently subtracted, with red color denoting potential planetary signals and blue indicating the rotation period. Model names correspond to those in Table 4. The 1 day alias period of the signals is marked with a triangle in lighter color. The dashed horizontal lines are the false alarm probabilities at 10%, 1% and 0.1%. From top to bottom: original data, model A, model D, model E, and model G.
Current usage metrics show cumulative count of Article Views (full-text article views including HTML views, PDF and ePub downloads, according to the available data) and Abstracts Views on Vision4Press platform.
Data correspond to usage on the plateform after 2015. The current usage metrics is available 48-96 hours after online publication and is updated daily on week days.
Initial download of the metrics may take a while.