Fig. 7
Download original image
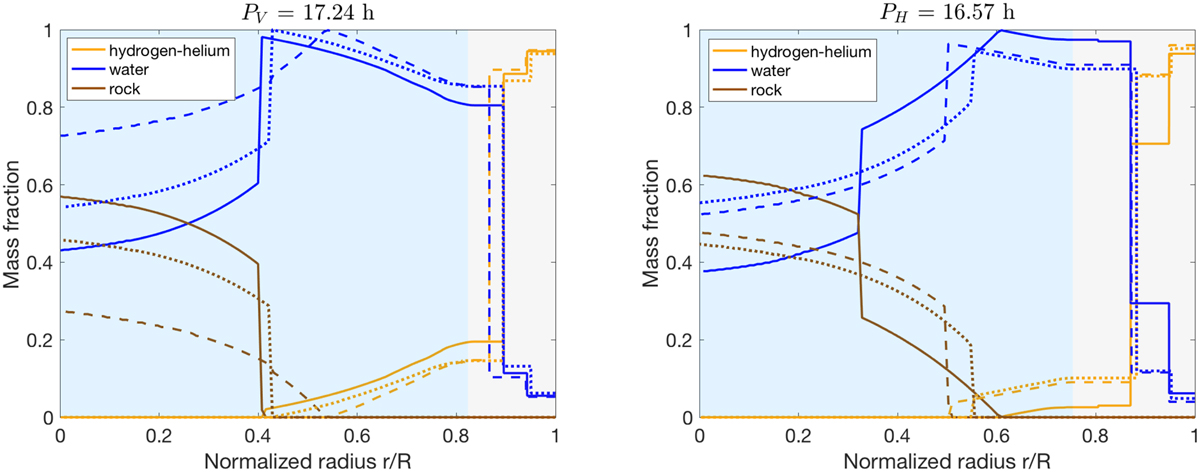
Radial mass fractions of the H–He mixture, water, and rock of Uranus models using PV (left panel) and PH (right panel). The solid, dashed, and dotted curves show the mass fraction of different models. In the left panel, the solid and dashed curves show the most extreme models in terms of rock and water mass fractions, whereas the dotted curves mark an in-between model. The gray- and blue-colored areas mark the average of the convective and non-convective regions of the presented models.
Current usage metrics show cumulative count of Article Views (full-text article views including HTML views, PDF and ePub downloads, according to the available data) and Abstracts Views on Vision4Press platform.
Data correspond to usage on the plateform after 2015. The current usage metrics is available 48-96 hours after online publication and is updated daily on week days.
Initial download of the metrics may take a while.