Open Access
Fig. 6
Download original image
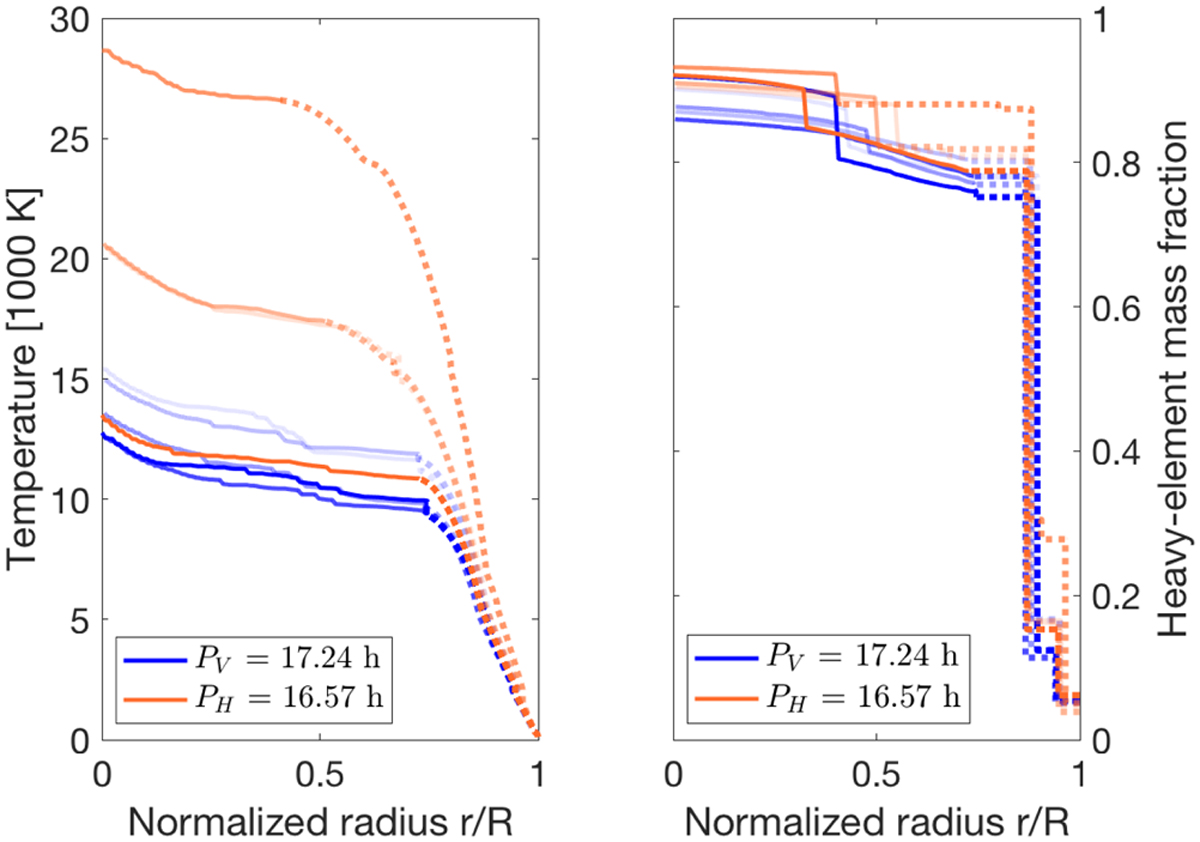
Temperature (left panel) and metallicity (right panel) profiles of Uranus models with different rotation periods. Different orange and blue shades are used to make individual models traceable across the two panels. The dotted (solid) part of each curve corresponds to convective (non-convective) regions.
Current usage metrics show cumulative count of Article Views (full-text article views including HTML views, PDF and ePub downloads, according to the available data) and Abstracts Views on Vision4Press platform.
Data correspond to usage on the plateform after 2015. The current usage metrics is available 48-96 hours after online publication and is updated daily on week days.
Initial download of the metrics may take a while.