Fig. 5.
Download original image
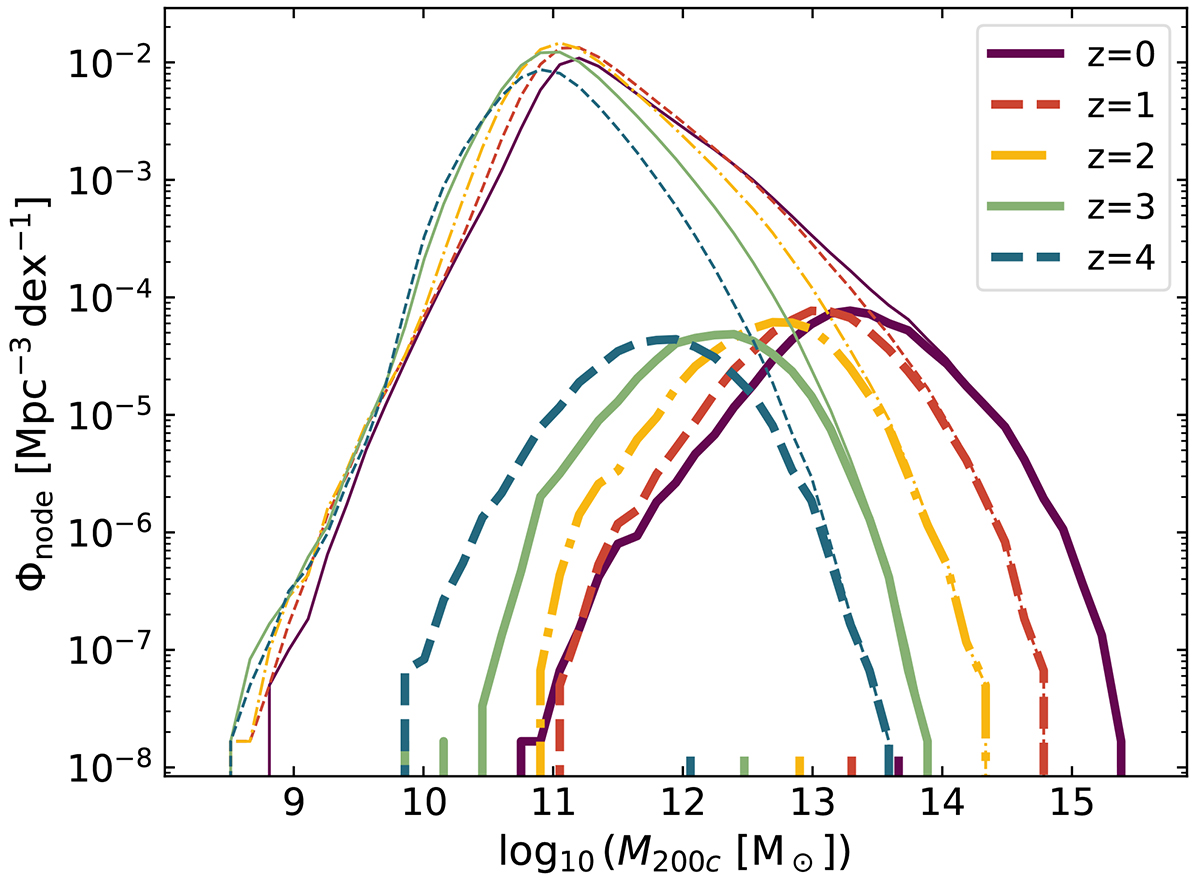
Mass function of the nodes connected to the filaments at different redshifts (thick curves). The vertical marks show the mean masses, which are ![]() , 13.30, 12.90, 12.47, and 12.06, respectively, from z = 0 to 4. For comparison, the thin curves give the mass functions of all the FoF haloes of the MTNG simulation with a stellar mass content of at least 108 M⊙.
, 13.30, 12.90, 12.47, and 12.06, respectively, from z = 0 to 4. For comparison, the thin curves give the mass functions of all the FoF haloes of the MTNG simulation with a stellar mass content of at least 108 M⊙.
Current usage metrics show cumulative count of Article Views (full-text article views including HTML views, PDF and ePub downloads, according to the available data) and Abstracts Views on Vision4Press platform.
Data correspond to usage on the plateform after 2015. The current usage metrics is available 48-96 hours after online publication and is updated daily on week days.
Initial download of the metrics may take a while.