Fig. 10.
Download original image
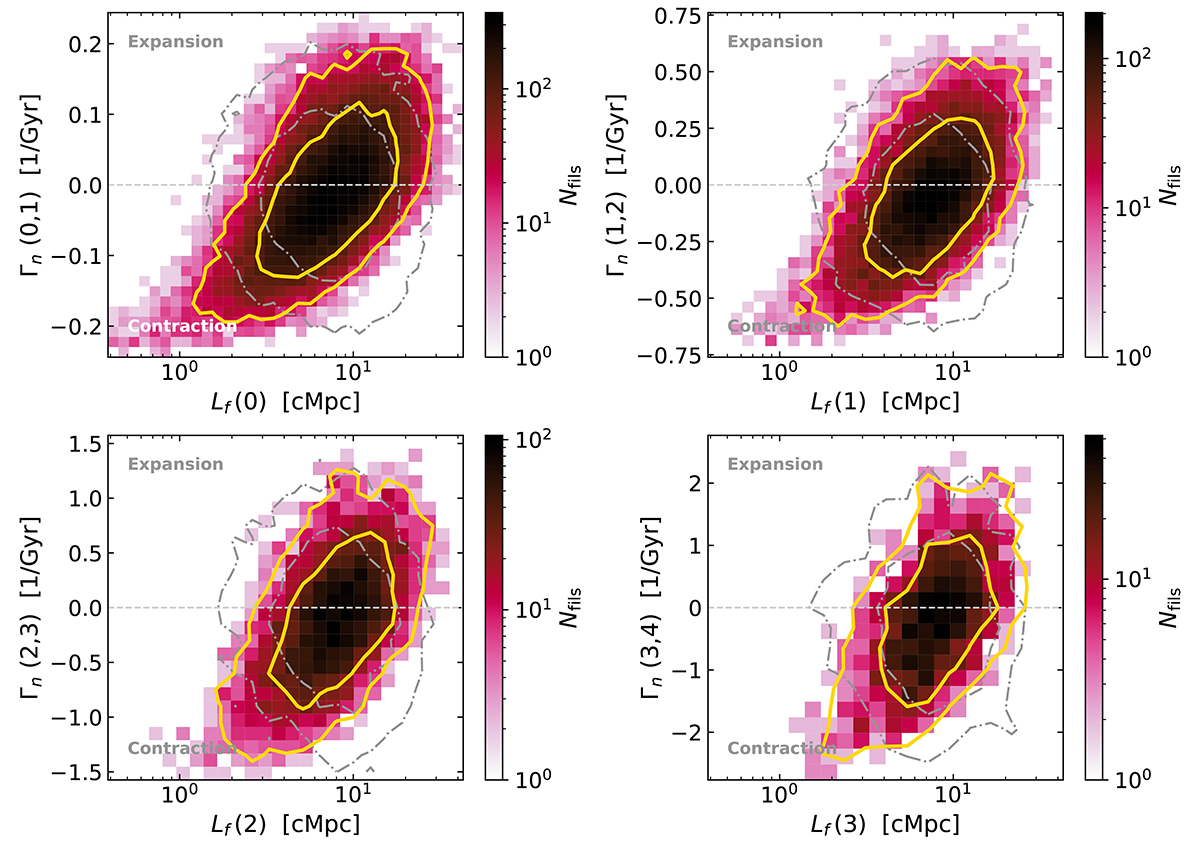
Normalised growth rate Γn (Eq. (2)) vs. filament length for four consecutive redshift intervals. For each panel, the x-axis corresponds to the filament lengths of the lowest redshift of the interval. The yellow lines indicate the 68% and 95% contours of the signal (pink colourbar), while the grey contours correspond to a random signal computed by associating filaments and progenitors in a random way, thus breaking the structure of the evolutionary tracks.
Current usage metrics show cumulative count of Article Views (full-text article views including HTML views, PDF and ePub downloads, according to the available data) and Abstracts Views on Vision4Press platform.
Data correspond to usage on the plateform after 2015. The current usage metrics is available 48-96 hours after online publication and is updated daily on week days.
Initial download of the metrics may take a while.