Fig. 1.
Download original image
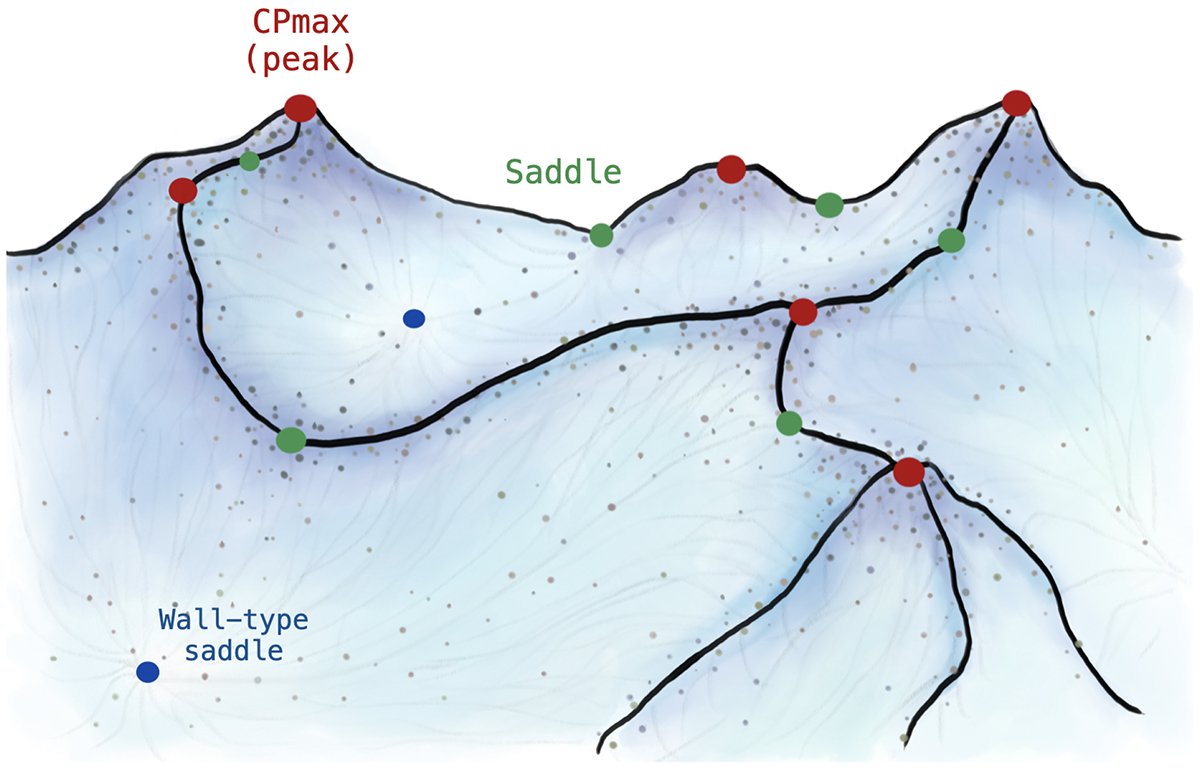
Sketch representing the large-scale density field and its topology using mountains as an analogy. The black lines following the ridges of the field represent the cosmic filaments. The red and green circles show, respectively, the positions of the CPmax, or peaks, and the (filament-type) saddles of the field. These are the endpoints of filaments within the DisPerSE framework. The blue circles locate the wall-type saddles of the field. Minimum density critical points are not represented.
Current usage metrics show cumulative count of Article Views (full-text article views including HTML views, PDF and ePub downloads, according to the available data) and Abstracts Views on Vision4Press platform.
Data correspond to usage on the plateform after 2015. The current usage metrics is available 48-96 hours after online publication and is updated daily on week days.
Initial download of the metrics may take a while.