Fig. 9.
Download original image
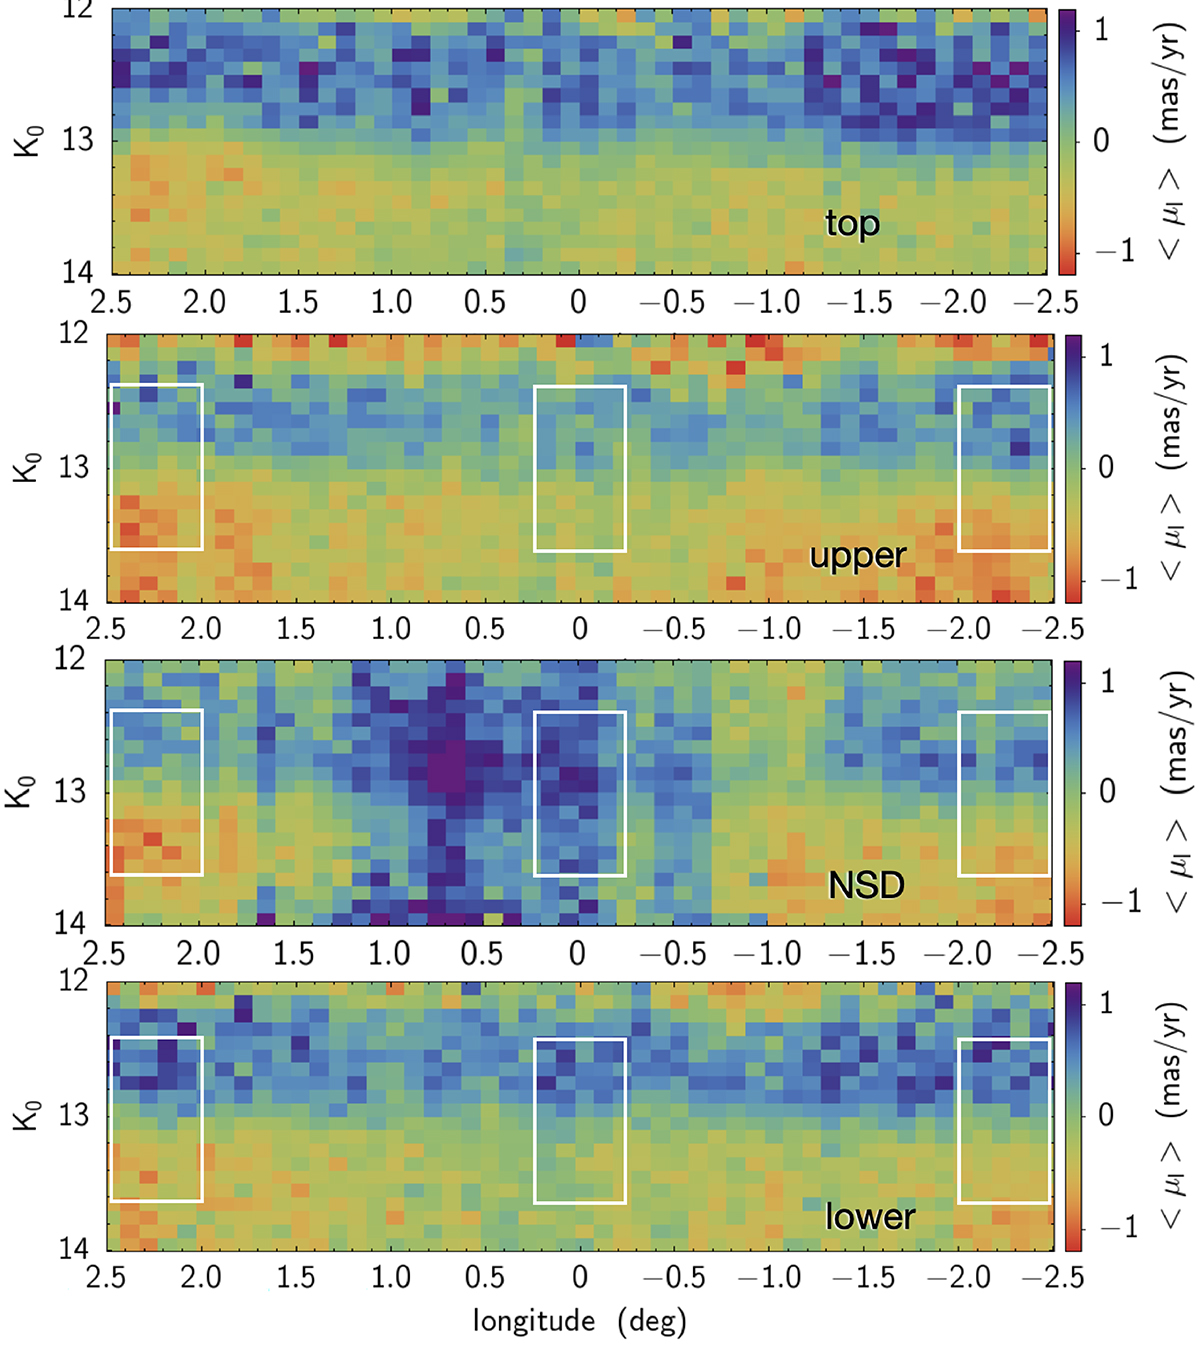
Data for the four zones defined in Fig. 4, now covering a wider longitude range. As indicated by the label, the regions are, from top to bottom: the “top” region, the upper control field, the NSD region, and the lower control field. Within each panel, we show a map of the median μl as a function of longitude in the x-axis and of K0 in the y-axis. Everywhere except in the central region of the middle panel (i.e., toward the NSD) the stars in the upper half of the map show a net positive μl, while stars in the lower half show a net negative μl. This can be interpreted by assuming that stars in the upper half are brighter than the mean RC, which is roughly at K0 ∼ 13, hence closer to us with respect to the GC, while stars in the bottom half are fainter than the mean RC, hence behind the GC. In the central region of the NSD strip, instead, we see only stars with a large positive median μl. We interpret this result as an evidence that, in this direction, we see mainly stars in the near side of the NSD. The white rectangles show the regions examined in Fig. 12.
Current usage metrics show cumulative count of Article Views (full-text article views including HTML views, PDF and ePub downloads, according to the available data) and Abstracts Views on Vision4Press platform.
Data correspond to usage on the plateform after 2015. The current usage metrics is available 48-96 hours after online publication and is updated daily on week days.
Initial download of the metrics may take a while.