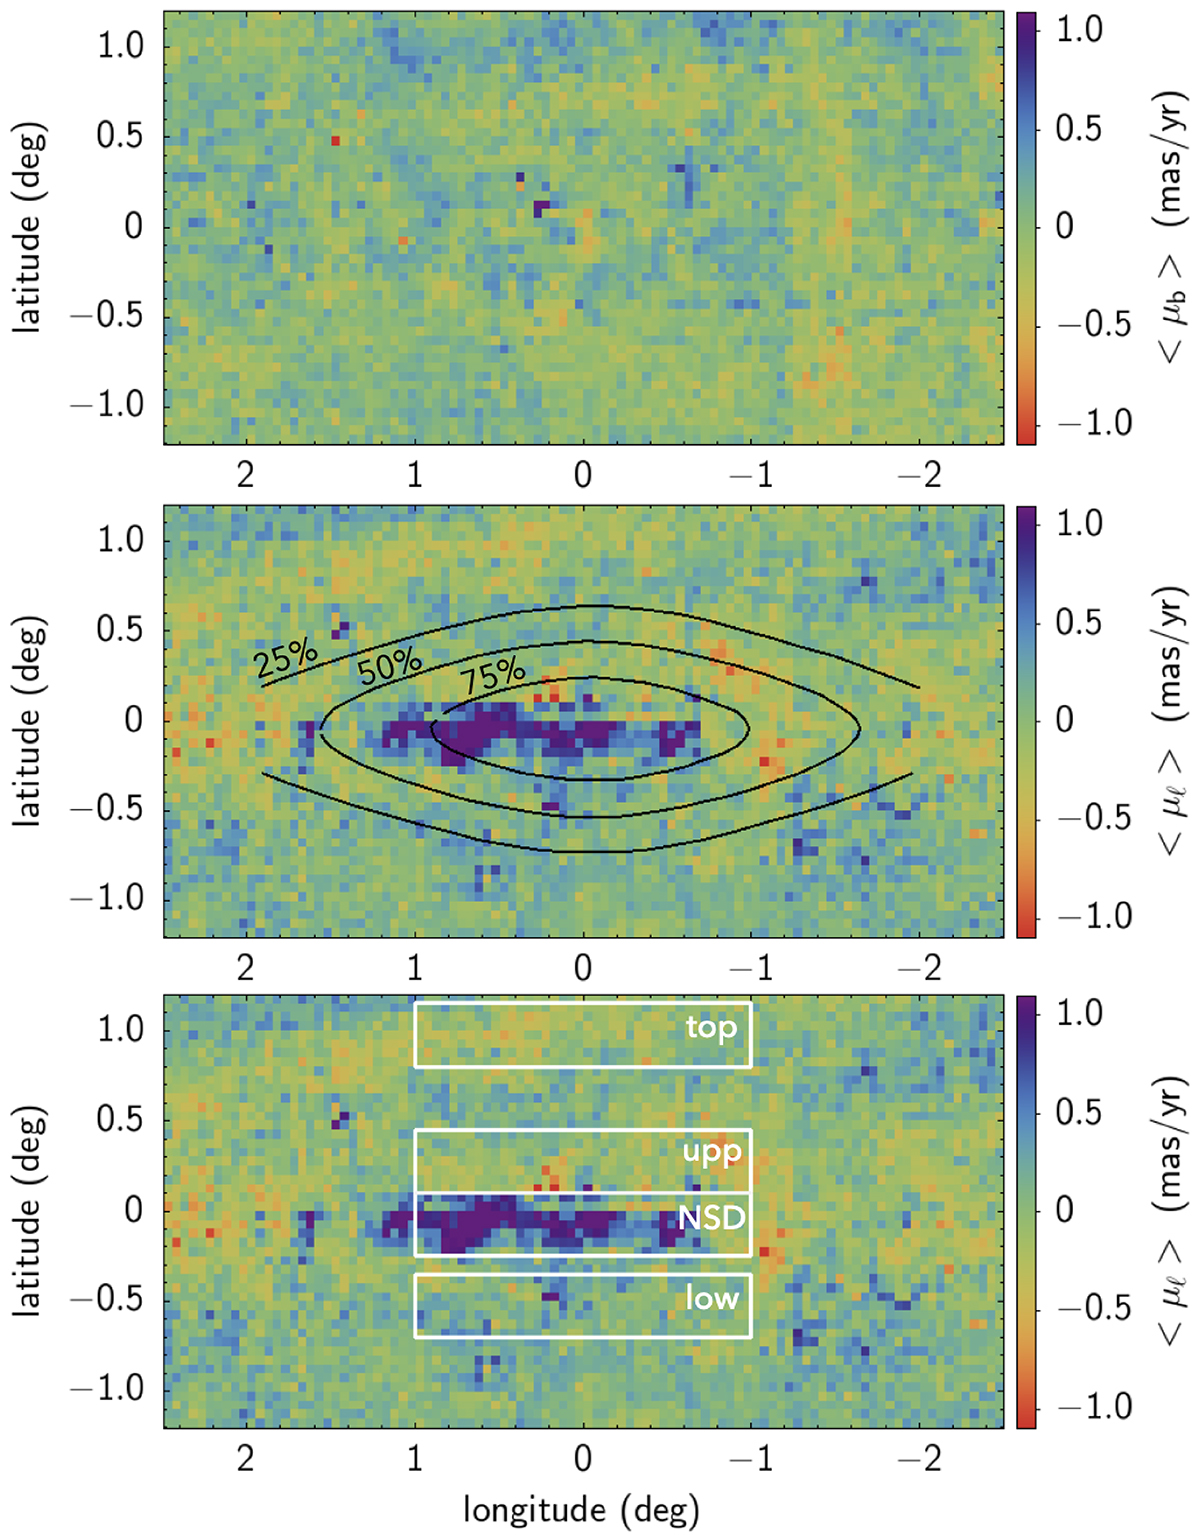
Fig. 7.
Download original image
Maps of the median PM in latitude (top) and longitude (middle and bottom) for RC stars in the nuclear region of the MW. As expected, the median latitude PM, ⟨μb⟩ is perfectly smooth and centered to zero, across the whole region. In contrast, the median longitude PM, ⟨μl⟩, shows a clear excess of stars with μl > 0 in the region of the NSD. In the bottom panel we reproduce the middle panel map, also showing the density contours of the Sormani et al. (2022) model (black), and the spatial regions analyzed in the following sections.
Current usage metrics show cumulative count of Article Views (full-text article views including HTML views, PDF and ePub downloads, according to the available data) and Abstracts Views on Vision4Press platform.
Data correspond to usage on the plateform after 2015. The current usage metrics is available 48-96 hours after online publication and is updated daily on week days.
Initial download of the metrics may take a while.