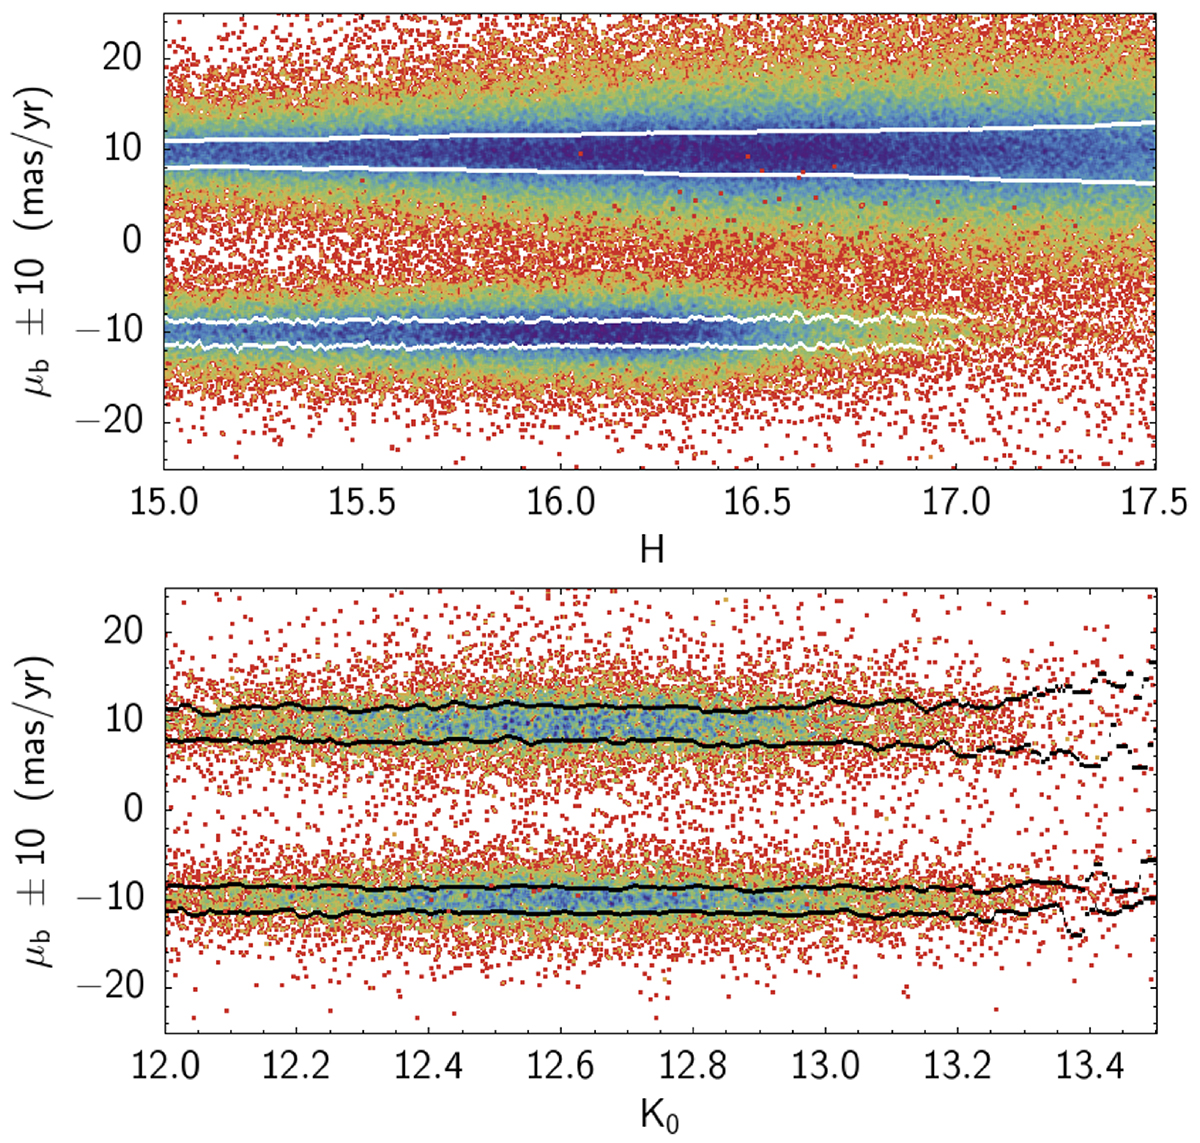
Fig. 5.
Download original image
Top panel: latitude PMs, μb in the VVV catalog presented here (upper distribution) and in the catalog by Shahzamanian et al. (2022; bottom distribution). We added (subtracted) 10 mas yr−1 to the VVV (Shahzamanian) distribution in order to avoid overlap. The white lines show the IQR for each distribution. Bottom panel: same as above, but only for the stars in common between the two catalogs, allowing us to use the K0 magnitude in the x-axis. Black lines show the IQR for each distribution.
Current usage metrics show cumulative count of Article Views (full-text article views including HTML views, PDF and ePub downloads, according to the available data) and Abstracts Views on Vision4Press platform.
Data correspond to usage on the plateform after 2015. The current usage metrics is available 48-96 hours after online publication and is updated daily on week days.
Initial download of the metrics may take a while.