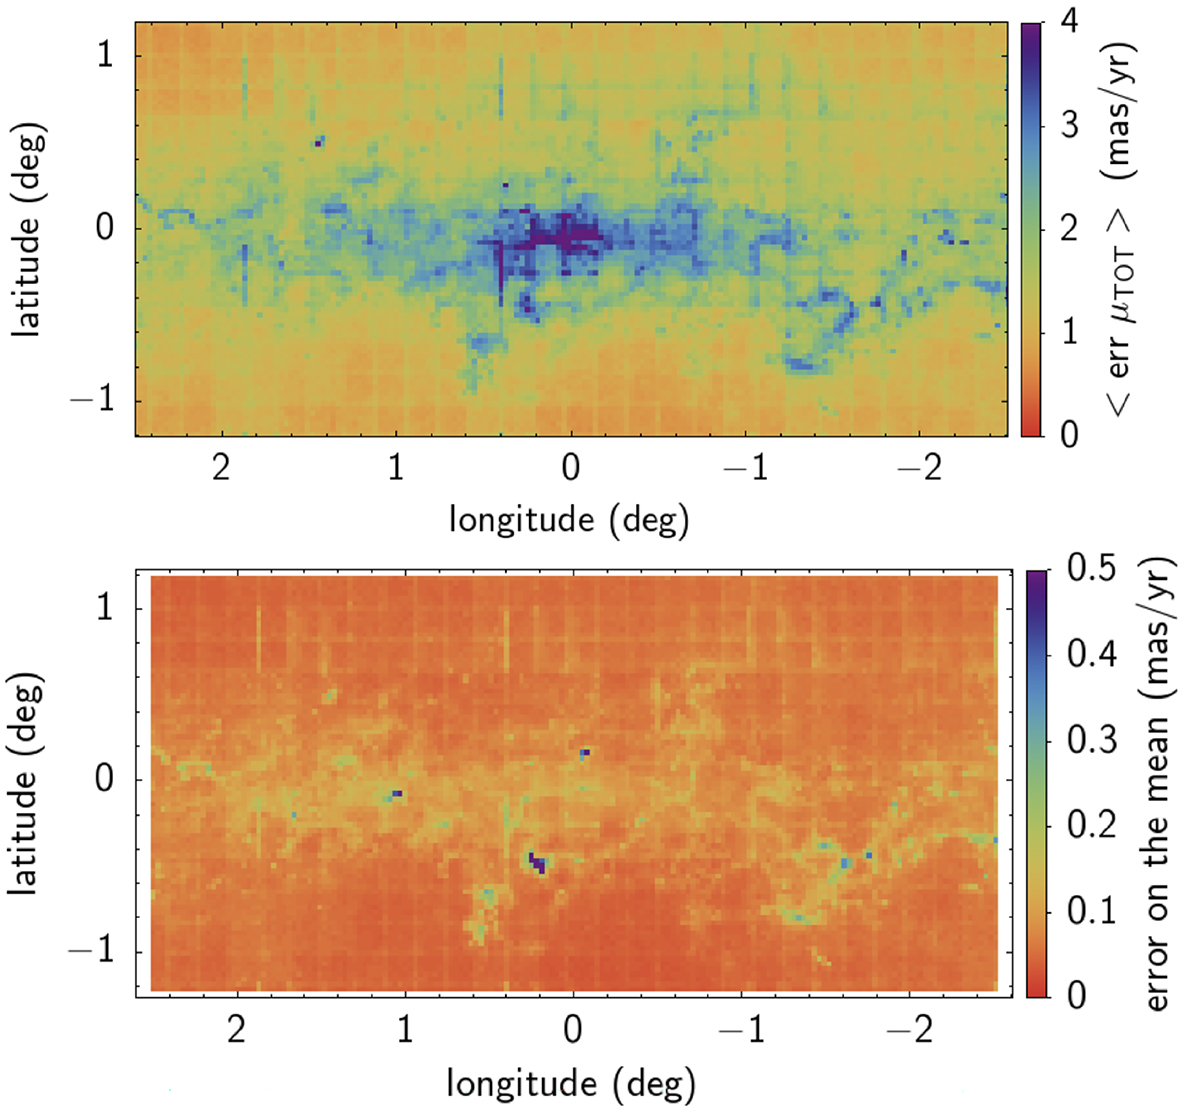
Fig. 4.
Download original image
Region analyzed in this work, color coded according to different parameters as shown in the side color bar. Top: colors indicate the median of the total PM error of individual stars. Because of the combination of crowding and extinction, the error in the individual PM measurements is larger in the NSD region. Bottom: median PM error of each pixel is divided by the square root of the number of stars (minus one) in each pixel. This map shows the spatial trend of the errors on the mean and median PM, across the sky.
Current usage metrics show cumulative count of Article Views (full-text article views including HTML views, PDF and ePub downloads, according to the available data) and Abstracts Views on Vision4Press platform.
Data correspond to usage on the plateform after 2015. The current usage metrics is available 48-96 hours after online publication and is updated daily on week days.
Initial download of the metrics may take a while.