Fig. 3.
Download original image
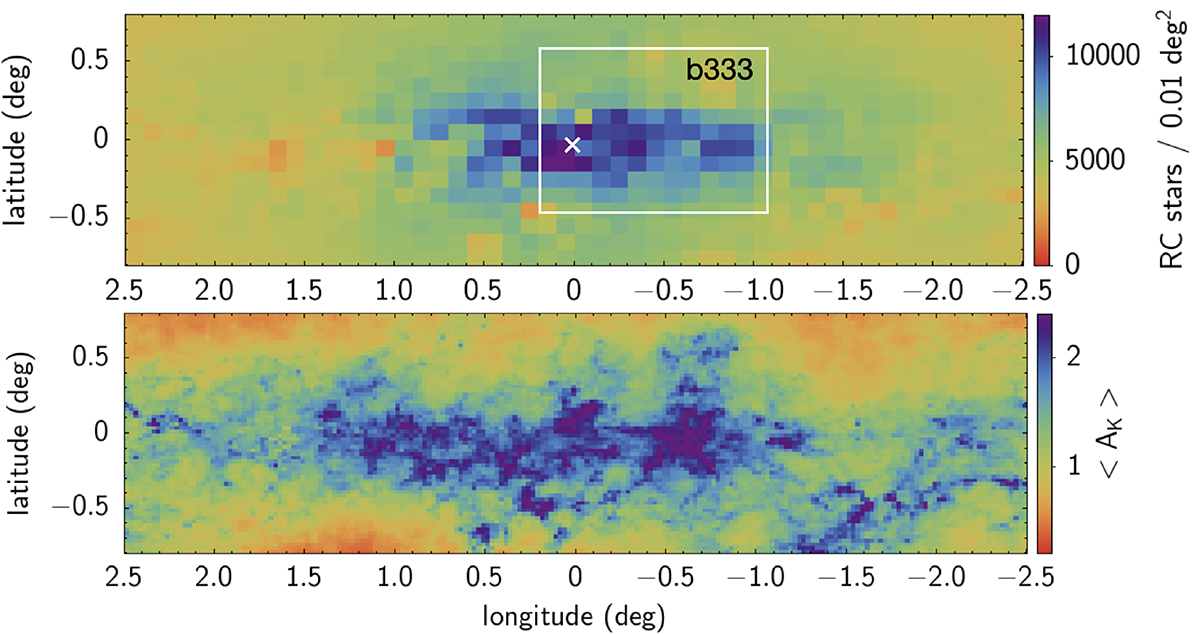
Region analyzed in this work in galactic coordinates. The map in the top panel is color coded by the projected surface density of RC stars, as observed, i.e., without completeness correction. A white cross shows the position of the GC and the coverage of the VVV b333 tile. The bottom map is color coded according to the median extinction AKs (see text for details).
Current usage metrics show cumulative count of Article Views (full-text article views including HTML views, PDF and ePub downloads, according to the available data) and Abstracts Views on Vision4Press platform.
Data correspond to usage on the plateform after 2015. The current usage metrics is available 48-96 hours after online publication and is updated daily on week days.
Initial download of the metrics may take a while.