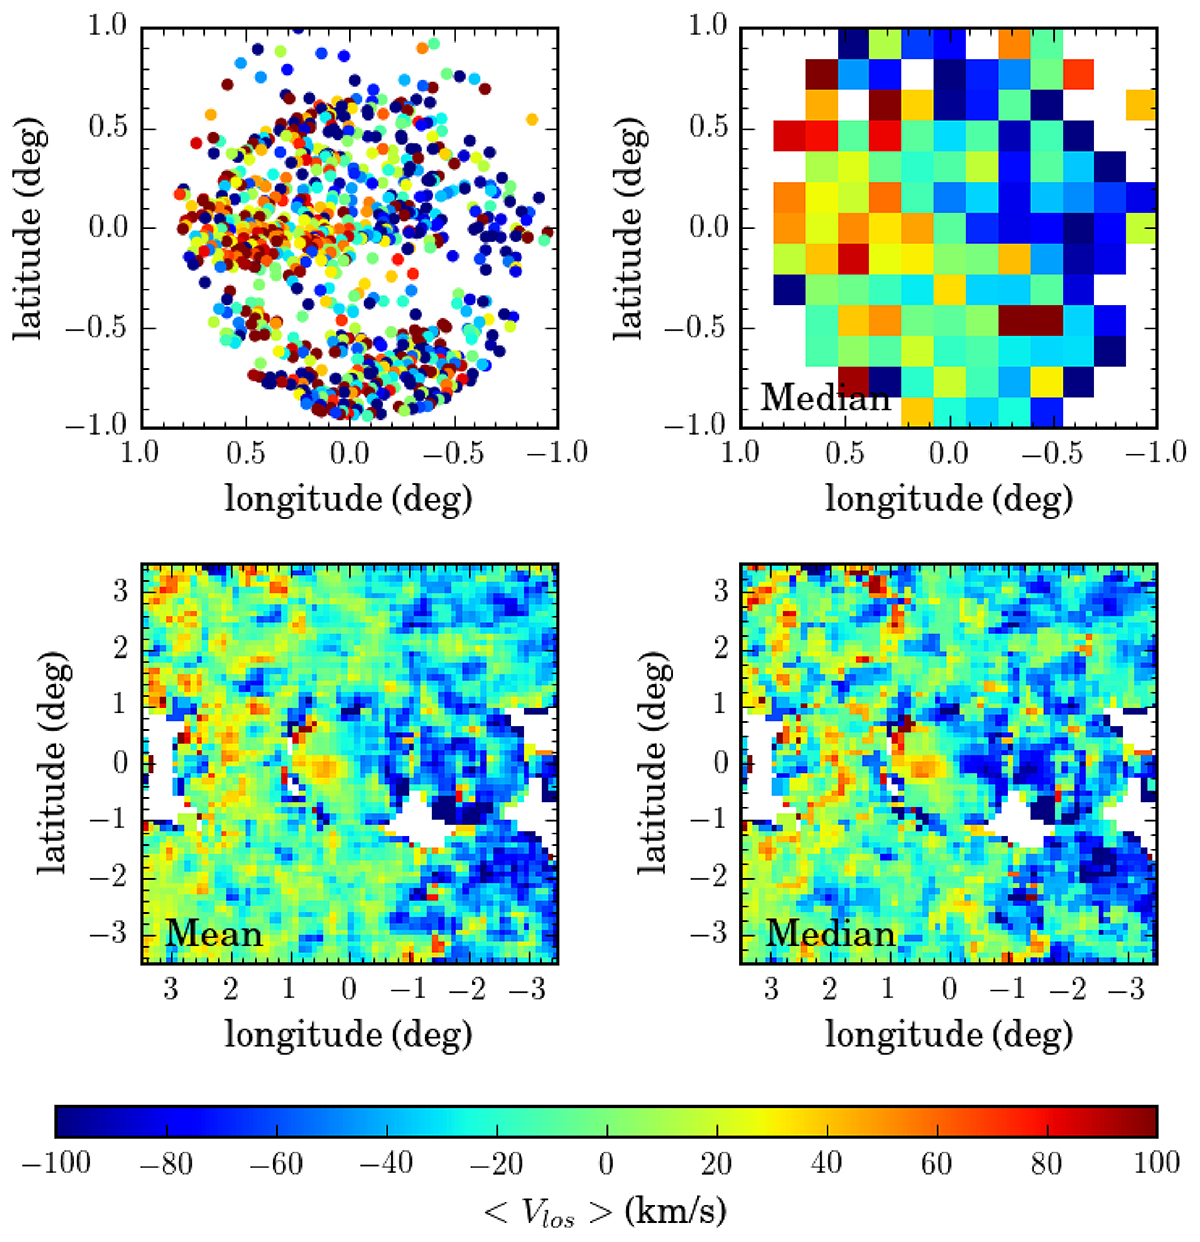
Fig. 13.
Download original image
Maps of the line of sight velocity (Vlos) of bulge stars in the APOGEE DR17 data. Top left: central plate of the APOGEE survey (called GALCEN) with individual target stars color coded according to their Vlos. Top right: same data binned. Colors show the median Vlos in each coordinate bin. Bottom: map of mean (left) and median (right) Vlos from an APOGEE DR17 sample covering a larger spatial area. Each bin contains the statistic computed from stars located over a region 3.5 times larger than the pixel itself. The color bar at the bottom applies to all the panels.
Current usage metrics show cumulative count of Article Views (full-text article views including HTML views, PDF and ePub downloads, according to the available data) and Abstracts Views on Vision4Press platform.
Data correspond to usage on the plateform after 2015. The current usage metrics is available 48-96 hours after online publication and is updated daily on week days.
Initial download of the metrics may take a while.