Fig. 11.
Download original image
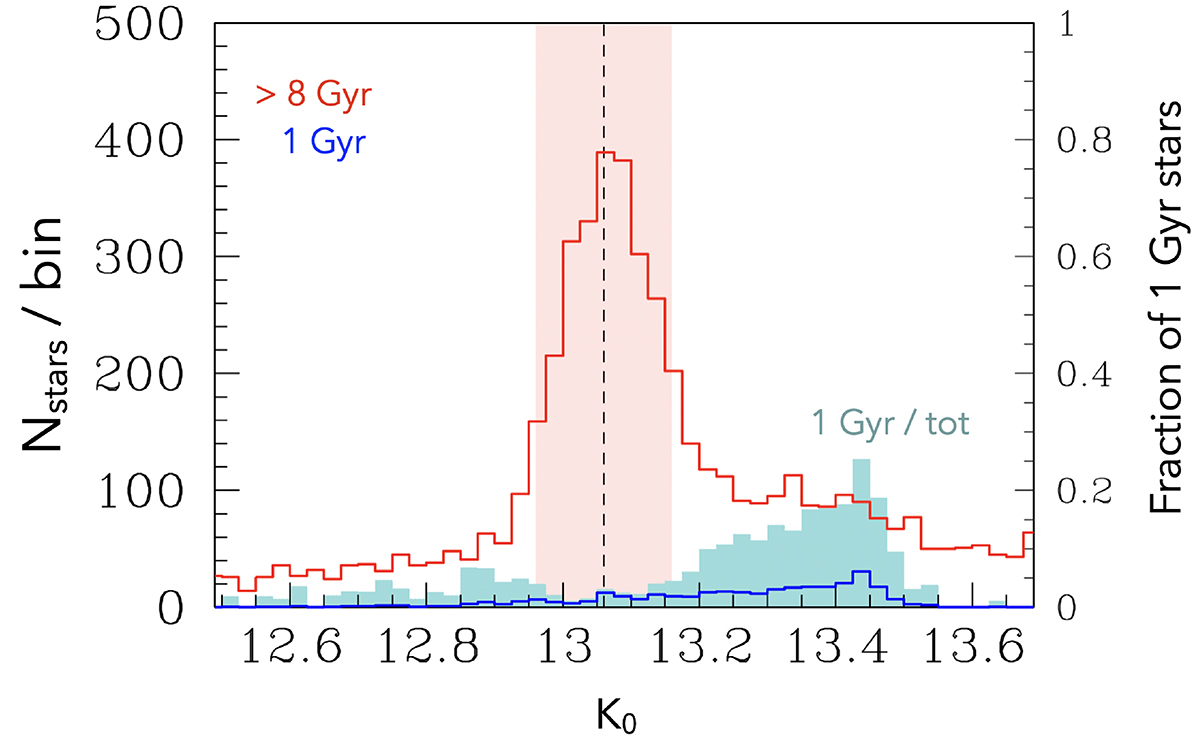
Luminosity function of the RC region for two synthetic populations, both located at 8.2 kpc. The red one has been simulated assuming constant Star Formation History between 8 and 13 Gyr ago, while the blue one has a single burst 1 Gyr ago, making up 5% of the total stellar mass. The light blue shaded histogram shows the fraction of 1 Gyr old stars, over the total (red+blue), according to the scale on the right y-axis.
Current usage metrics show cumulative count of Article Views (full-text article views including HTML views, PDF and ePub downloads, according to the available data) and Abstracts Views on Vision4Press platform.
Data correspond to usage on the plateform after 2015. The current usage metrics is available 48-96 hours after online publication and is updated daily on week days.
Initial download of the metrics may take a while.