Fig. 10.
Download original image
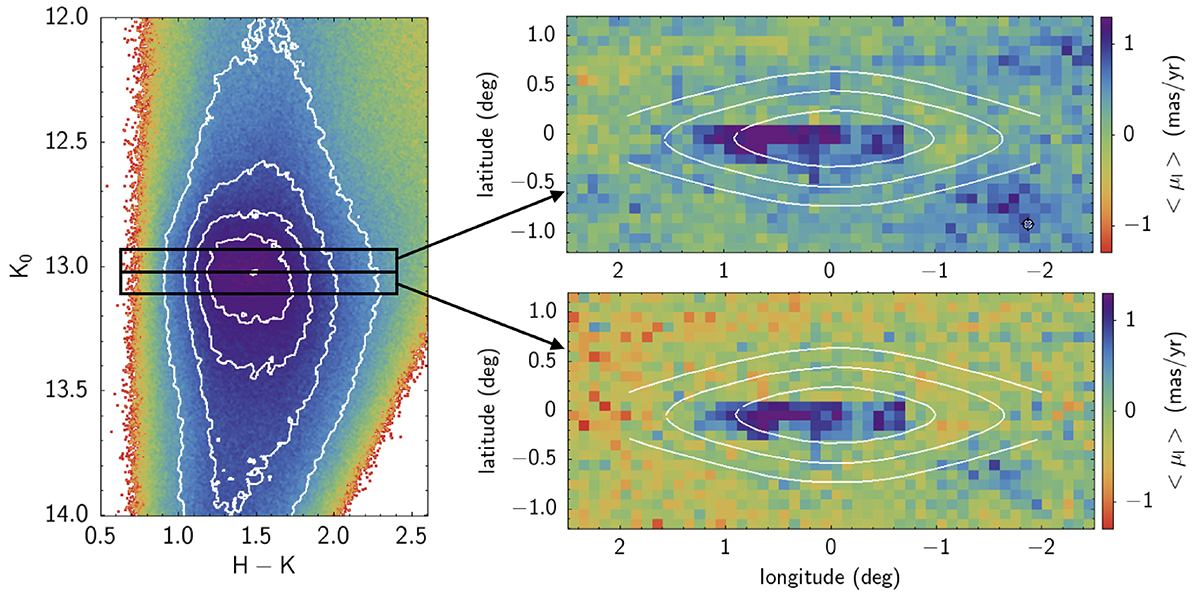
Left: RC region of the CMD for a broad region encompassing the NSD, just for illustrative purposes. Two black boxes highlight stars within ΔK0 = ±0.1 mag above and below the RC peak. These two samples should be dominated by RC stars at distances within ±380 pc from the GC (see text for details). Top right: map of the median longitude PM for the stars < 0.1 brighter than the RC peak. Bottom right: same thing for stars < 0.1 mag fainter than the RC peak. White lines show the density contour of the Sormani et al. (2022) model.
Current usage metrics show cumulative count of Article Views (full-text article views including HTML views, PDF and ePub downloads, according to the available data) and Abstracts Views on Vision4Press platform.
Data correspond to usage on the plateform after 2015. The current usage metrics is available 48-96 hours after online publication and is updated daily on week days.
Initial download of the metrics may take a while.