Open Access
Fig. 1.
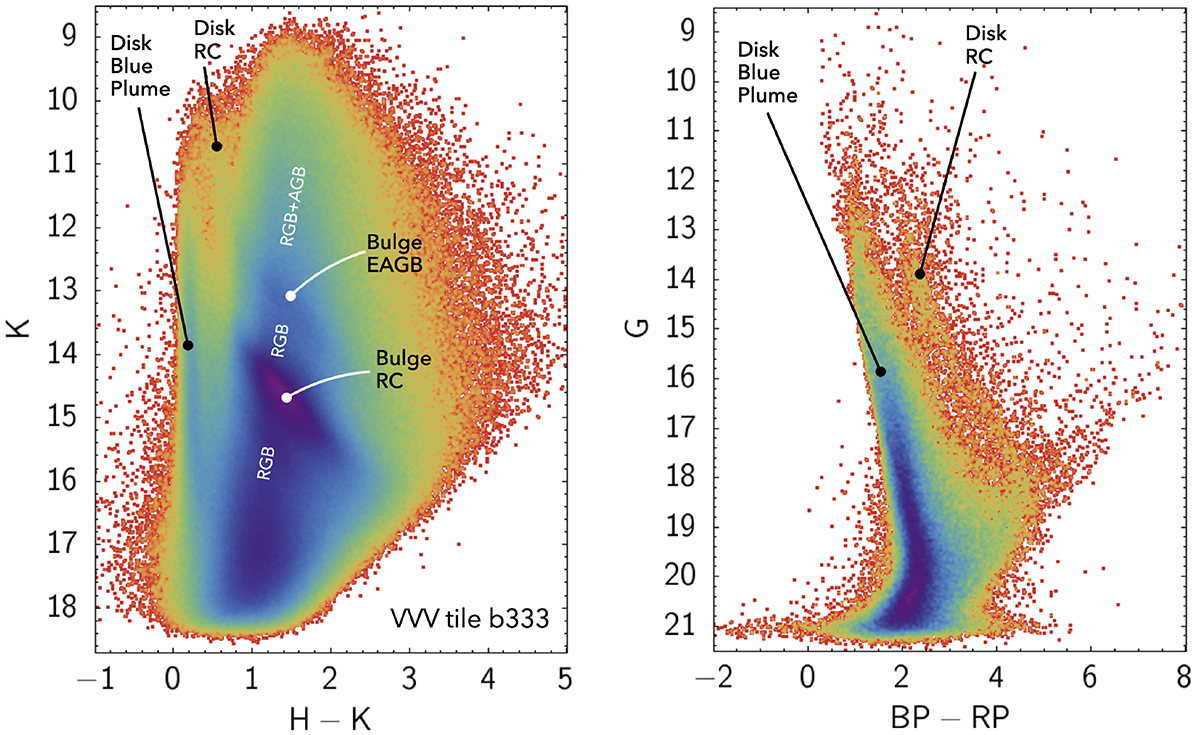
Download original image
CMD of the central region of the present catalog (tile b333) as seen in VVV (left) and in Gaia DR3 (right). The K magnitude is always the Ks band of VVV calibrated to 2MASS (see text), here labeled simply K to avoid too many subindices. The main features of both diagrams are labeled here and explained in the text.
Current usage metrics show cumulative count of Article Views (full-text article views including HTML views, PDF and ePub downloads, according to the available data) and Abstracts Views on Vision4Press platform.
Data correspond to usage on the plateform after 2015. The current usage metrics is available 48-96 hours after online publication and is updated daily on week days.
Initial download of the metrics may take a while.