Fig. 7
Download original image
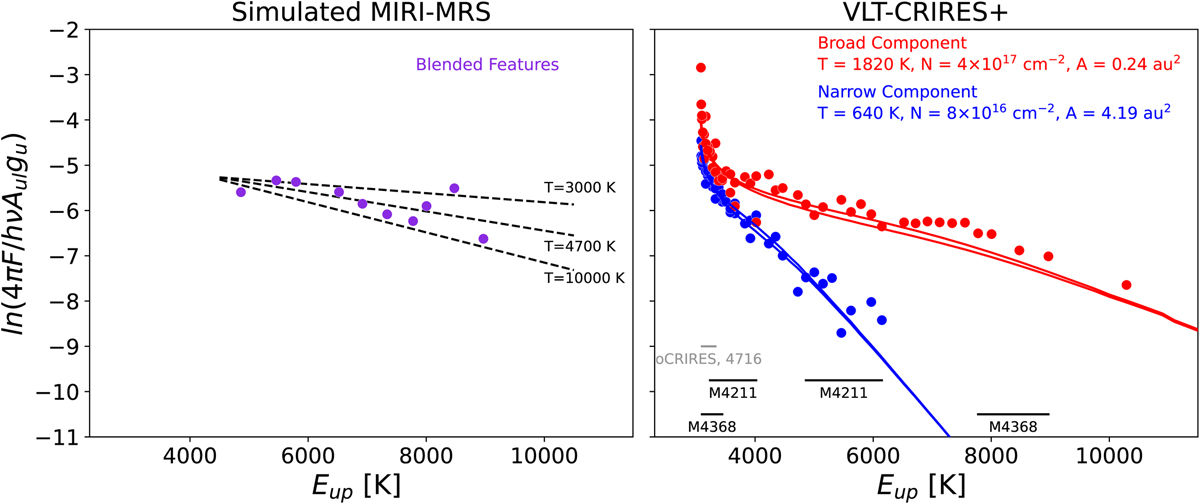
Rotational diagrams of the 12CO v = 1−0 transitions. On the left is a simulation of the S CrA N CRIRES+ data with the spectral resolution and wavelength coverage of JWST MIRI-MRS, which does not have the resolution to distinguish between different kinematic components and only covers high-J lines. Three optically thin models with different temperatures are shown for illustration. The 4700 K is the best linear fit result. On the right is what is observed with VLT-CRIRES+. Only detected transitions are shown. The lines correspond to a linear fit to the simulated MIRI data (left) and the best-fit LTE model to the CRIRES+ data (right). In order to constrain the gas temperature and column density, sufficient upper energy level coverage is needed. In the right panel, we provide the coverage of two M-band filters of CRIRES+ (black) that provide sufficient to characterize the CO gas. The coverage of one of the oCRIRES filters is shown in grey. The upgrades to CRIRES+ result in greater energy level coverage with a single filter. The two model lines correspond to the P- and R-branch lines.
Current usage metrics show cumulative count of Article Views (full-text article views including HTML views, PDF and ePub downloads, according to the available data) and Abstracts Views on Vision4Press platform.
Data correspond to usage on the plateform after 2015. The current usage metrics is available 48-96 hours after online publication and is updated daily on week days.
Initial download of the metrics may take a while.