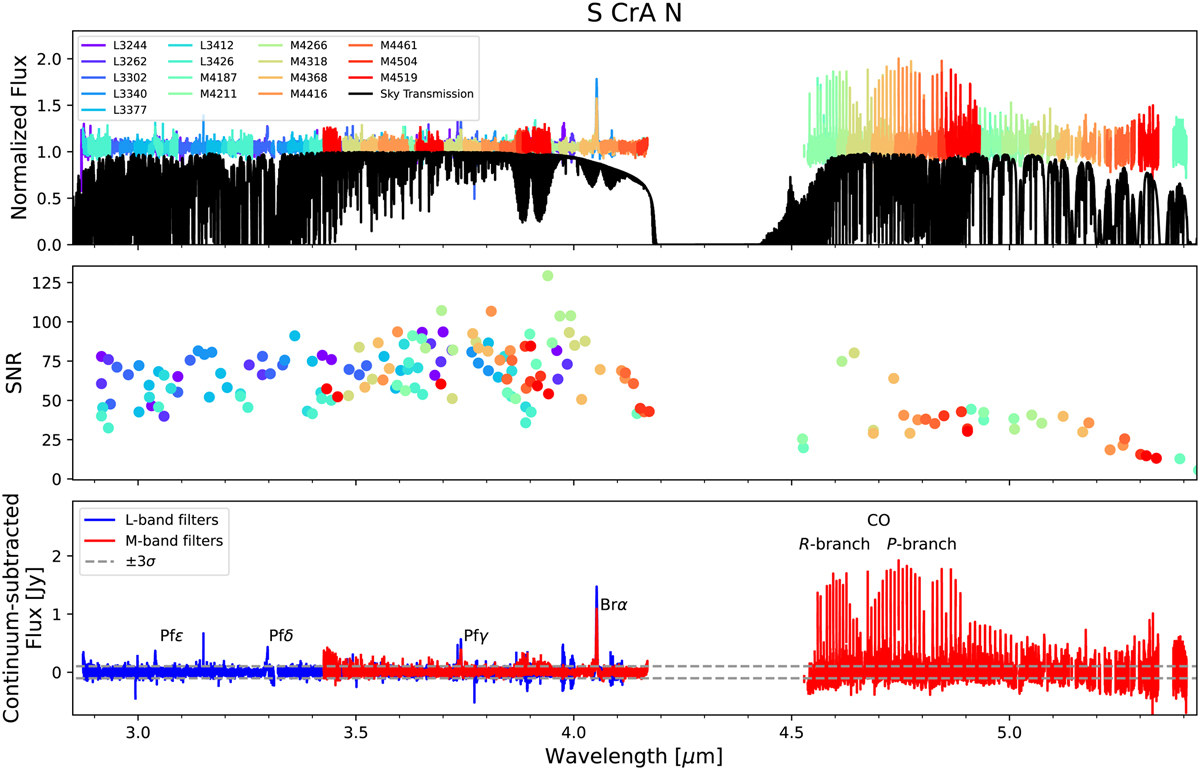
Fig. 2
Download original image
Top: S CrA N CRIRES+ reduced and telluric-corrected spectra in all available L- and M-band settings (colors). The wavelength separation of the orders can be seen; for instance, the M4519 (red) filter shows five orders (two orders fall in the telluric absorption gap from 4.2 to 4.5 μm). Note that between 3.4 and 4.2 μm L- and M-band filters overlap. The sky transmission is shown in black, for reference. Middle: The signal-to-noise ratio for each filter, order, and detector in the S CrA N spectra. Bottom: The combined L- (blue) and M-band (red) spectra for S CrA N after flux calibration and continuum subtraction. Prominent emission features are labeled. Regions where the atmospheric transmission is below 50% are masked. The gray lines indicate the ±3σ regions for reference.
Current usage metrics show cumulative count of Article Views (full-text article views including HTML views, PDF and ePub downloads, according to the available data) and Abstracts Views on Vision4Press platform.
Data correspond to usage on the plateform after 2015. The current usage metrics is available 48-96 hours after online publication and is updated daily on week days.
Initial download of the metrics may take a while.